

Introduction
In this tutorial, we will learn steps to debug a C Program. The IDE used in the tutorial is Code:: Blocks.
Debugging a C program saves you countless hours guessing what went wrong with your program. You can use the graphic debugger to debug the C program.
Debug a C program
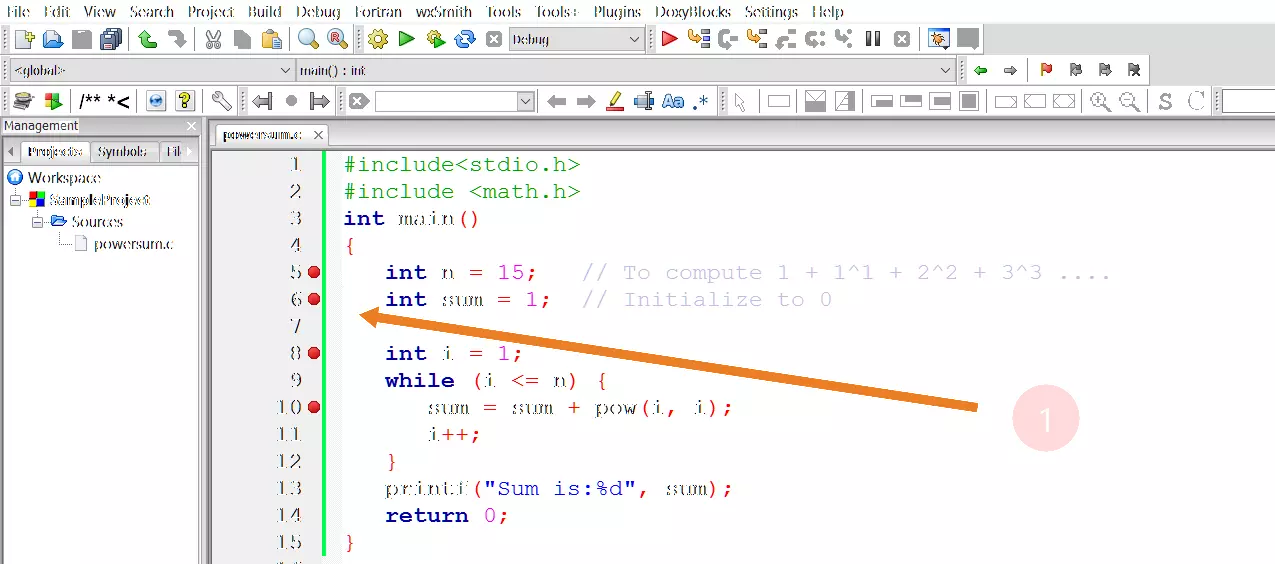
Set breakpoints on your program. A breakpoint suspends program execution for you to examine the internal states of your program. You can create a breakpoint by clicking on the left margin. A red circle appears indicating a breakpoint has been set at that particular line as shown below.
Alternatively, you can choose Toggle Breakpoint (F5) from the Debug menu.

Start Debugging
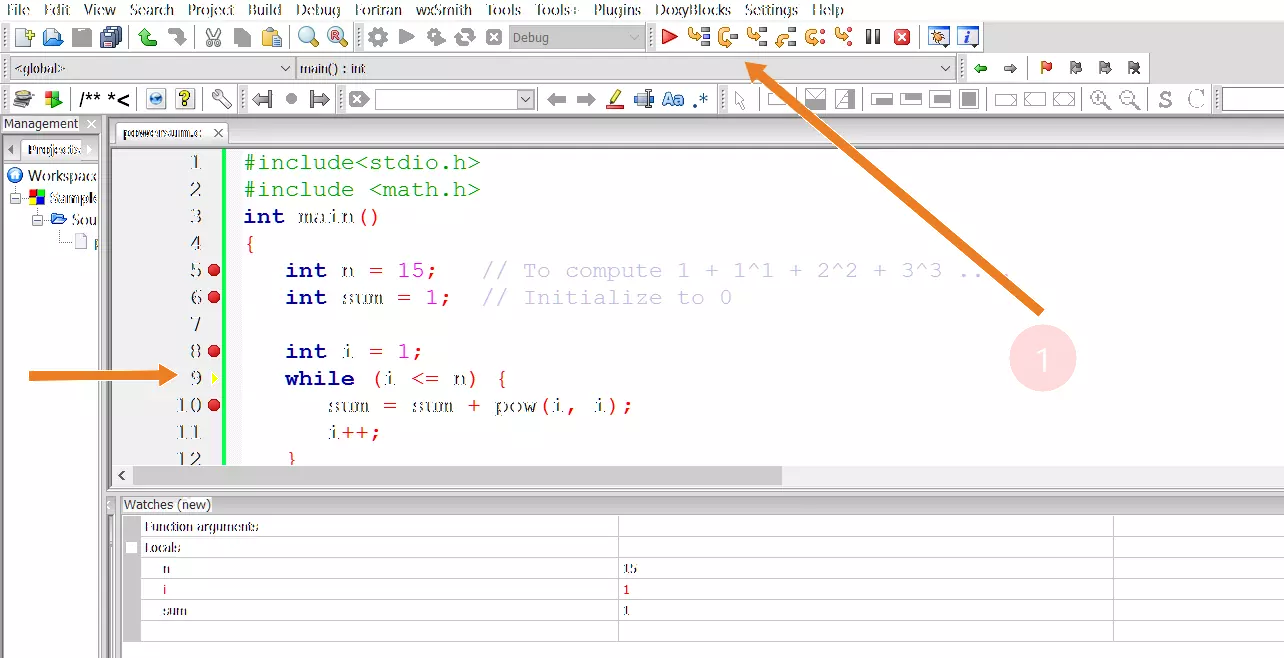
To start debugging the program, choose Debug menu >> Start (F8). The program begins execution but suspends its execution at the breakpoints. A yellow arrow appears and points at the next statement to be executed. Click the Debugging Windows button on the Debug toolbar and select Watches. This step enables the Watch pane.

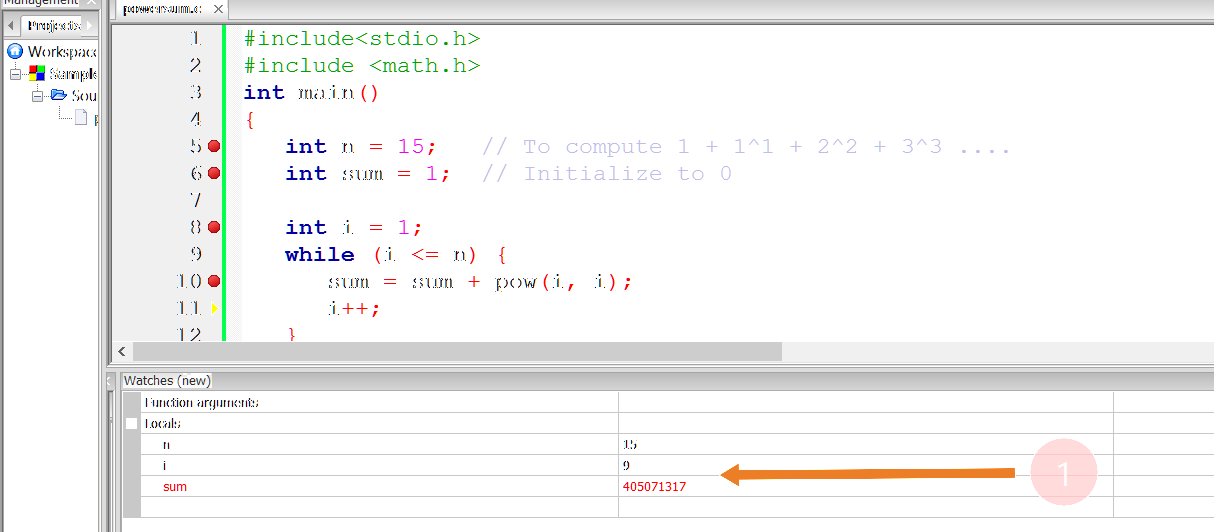
Click the Next line button on the toolbar to single-step thru your program. At each of the steps, you could examine the internal state of your program, such as the value of the variables, the outputs produced by the program, etc.

The Continue button resumes the program execution, up to the next breakpoint, or till the end of the program. The Stop button ends the debugging session. Always terminate your current debugging session using “Stop” or “Continue” till the end of the program.
—
To download and install Code Blocks follow the link:
https://www.testingdocs.com/download-and-install-codeblocks/
For more information on Code Blocks IDE, visit the official website of Code blocks IDE: