Debugging a RAPTOR Flowchart
Debugging a RAPTOR Flowchart
In this tutorial, we will learn the steps involved in debugging a RAPTOR flowchart. Debugging allows us to examine the output of a flowchart by running a step-by-step through each set of breakpoints on the flowchart symbols. Debugging helps us to detect an error in the flowchart. When the flowchart is not working as intended, we can debug the flowchart.
Breakpoint
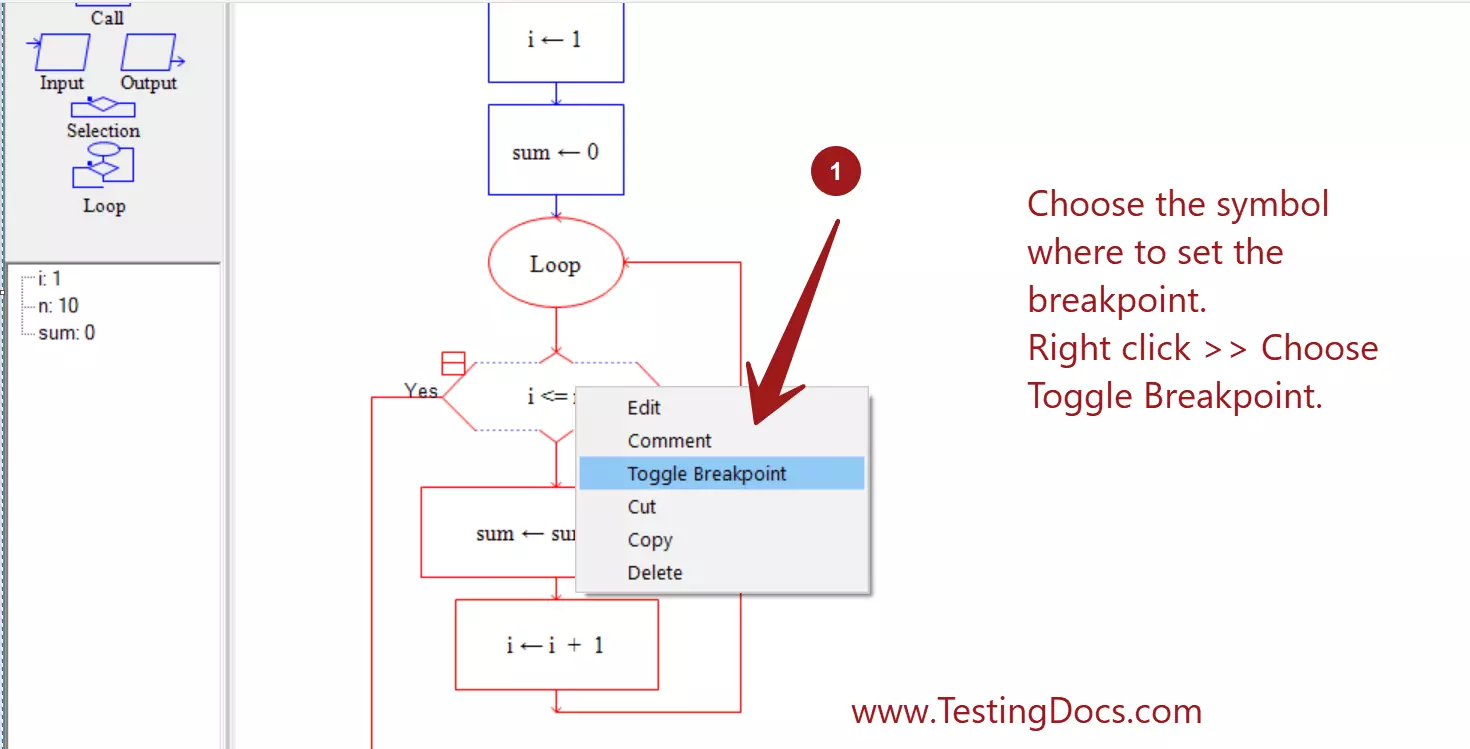
To set a breakpoint right click on the flowchart symbol and choose Toggle Breakpoint. A red bubble will appear on the symbol.
The flowchart execution will stop on the breakpoint flowchart symbol. We can analyze the variables in the watch window and trace the output to detect any error in the flowchart design.
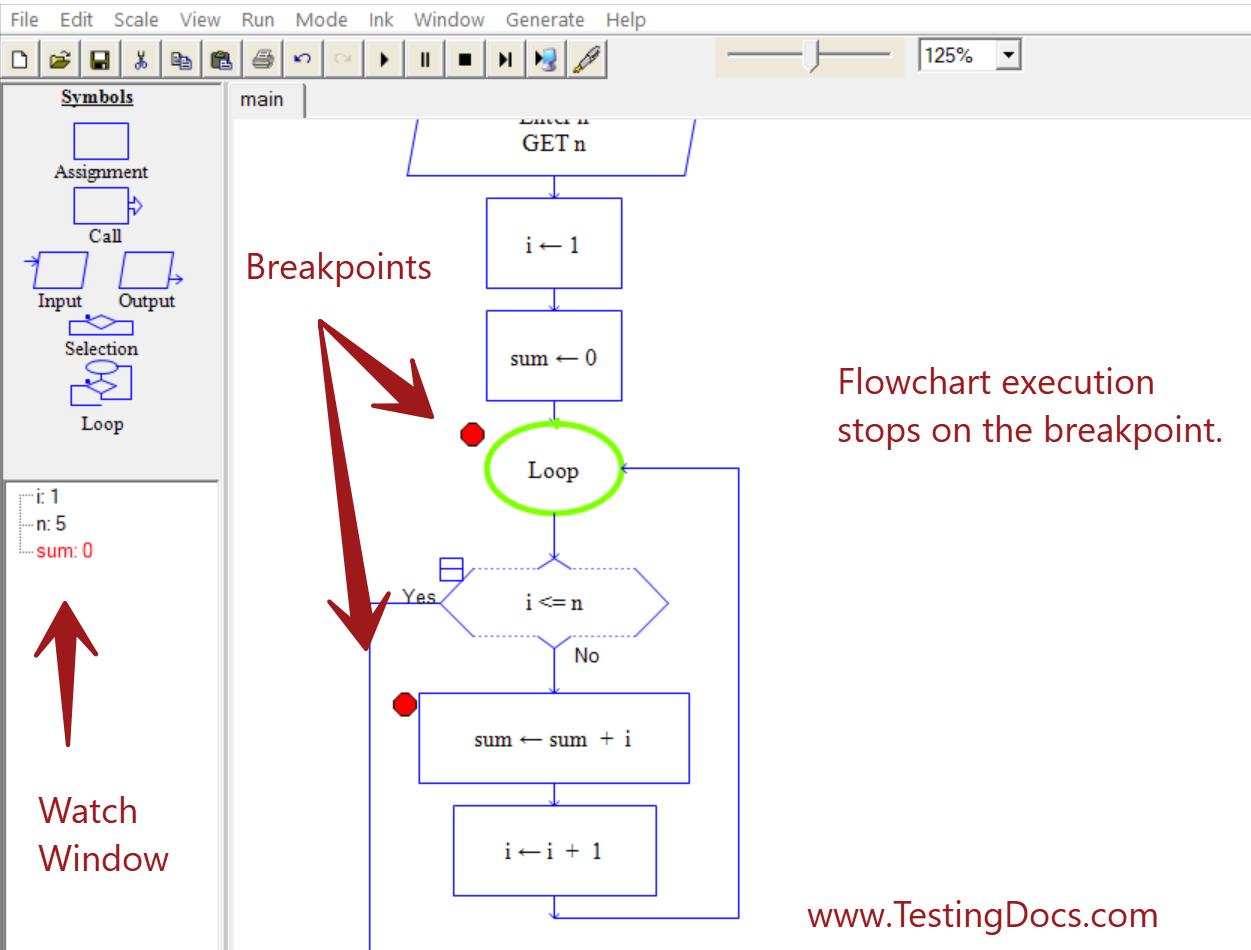
The current symbol that is being executed is highlighted in green color. Any variables that are changed by the execution of a flowchart symbol are highlighted in red in the Watch window.
In case if we want to clear the breakpoints in the flowchart, Choose Run >> Clear all breakpoints. This option will clear all the set breakpoints in the flowchart. This option is used after we are done with the debugging process.
Step
Step function executes the flowchart one symbol at a time. To execute the current symbol and move to the next symbol, we can use the Step function. To step choose the Run >> Step menu option. Alternatively, we can hit the F10 key.
Reset
To reset the debugging process choose Run >> Reset. This option halts the flowchart execution.
Raptor Tutorials on this website can be found at:
https://www.testingdocs.com/raptor-a-flowchart-tool/


