

Introduction
In this post, we will learn to use graphics programming in Raptor flowcharts. To use graphics, you must create a graphics window using the command called RaptorGraph.
https://www.testingdocs.com/getting-started-with-raptorgraph/
Open_Graph_Window
We can specify the height and width of the window to this command.
Open_Graph_Window(500,500)
would open a window screen with 500 height and 500 width as shown in the picture.
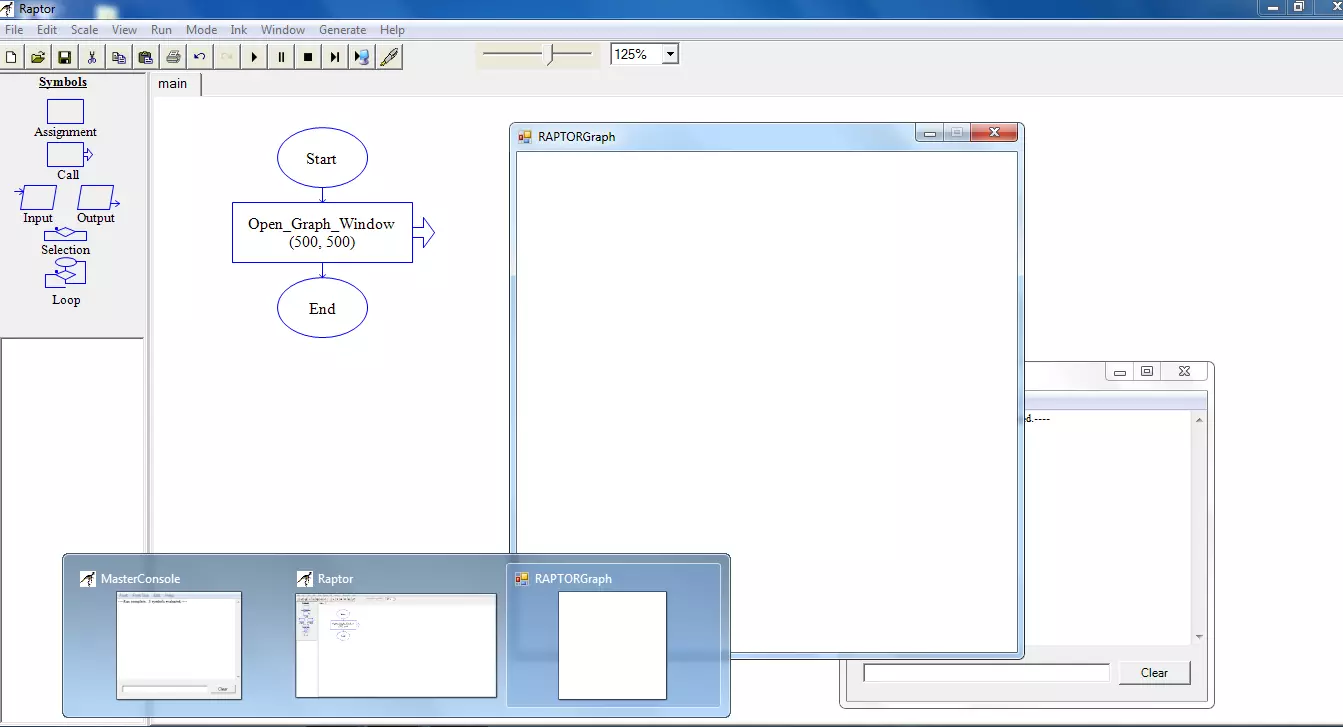

Once we add the graphics window, then we can add other elements to the window. For example, let’s add a circle to the window.
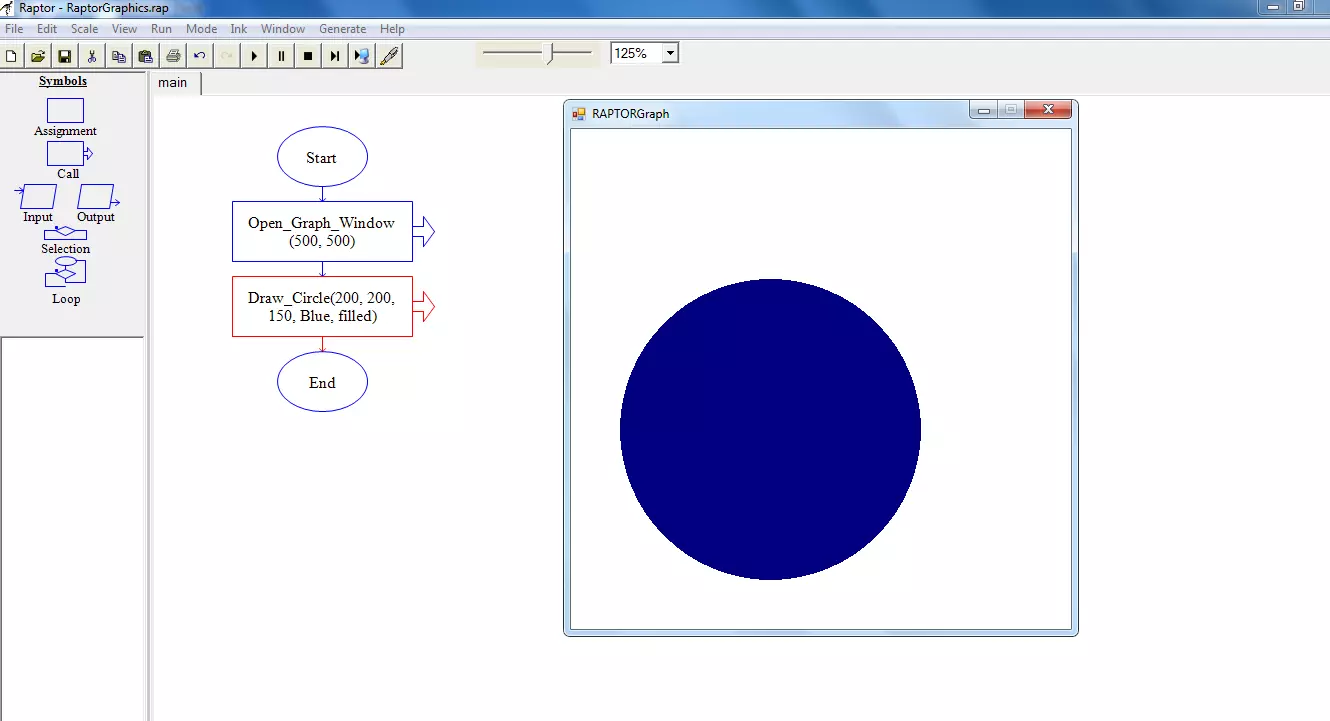
Draw a circle example
To draw a circle we can use the following command.
Draw_Circle(200,200,150,Blue,filled)
The above command will draw a circle with a blue color filled in the circle area as shown in the screenshot.

Practice adding more elements to the window like adding lines, triangles, ellipses, etc.
RAPTOR Tutorial Page: