Draw a flowchart using Draw.io
Draw a flowchart using Draw.io
This tutorial is a step-by-step guide to drawing a flowchart using Draw.io software. Drawing a flowchart involves representing a process or algorithm using standardized symbols and connecting them with arrows to indicate the flow of control. draw.io software tool allows you to create flowcharts digitally. It can be installed on your computer or online on the web. ( diagrams.net ). The tool provides pre-defined symbols and templates to make the process easier.
Draw a flowchart Steps
Launch the draw.io flowchart software. If the software is not installed on the computer, steps to install it can be found here.
Choose Create a new diagram.
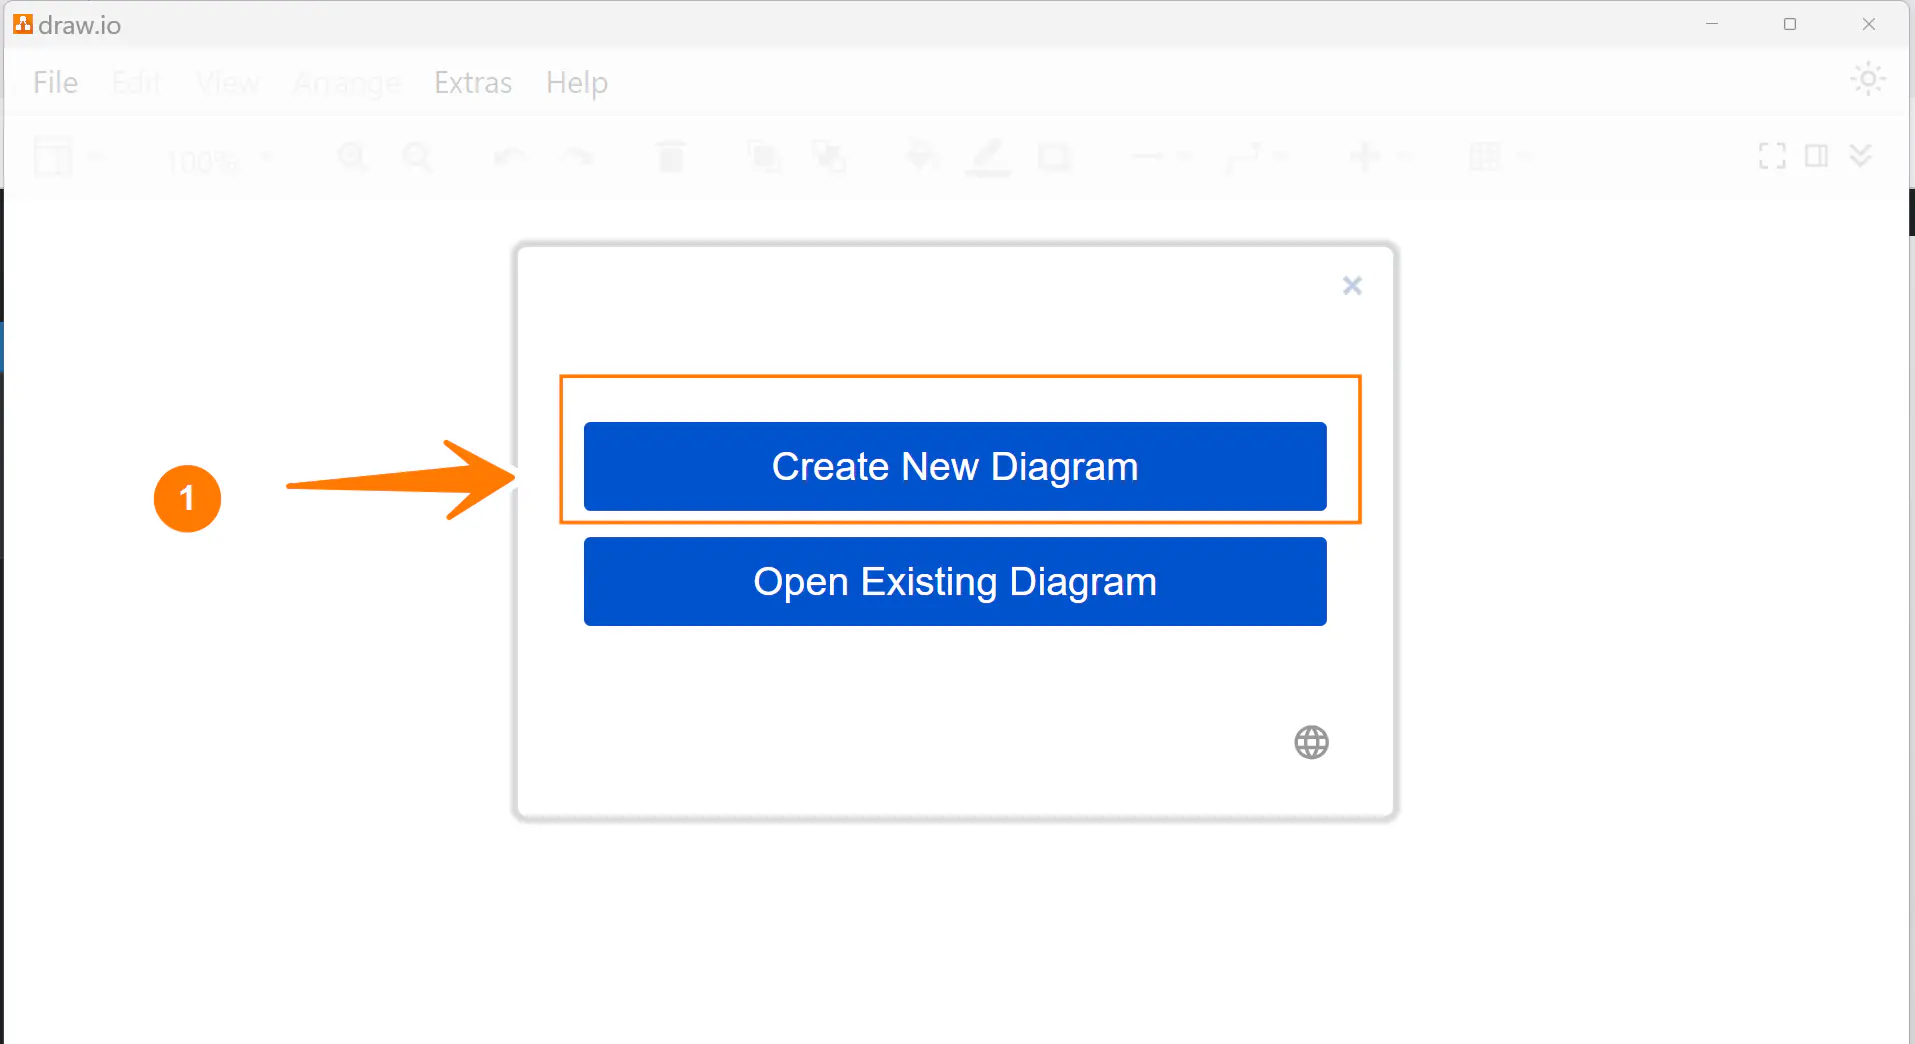
Choose the Flowchart option to create from the template.
Alternatively, we can choose a Blank Diagram to start from scratch.
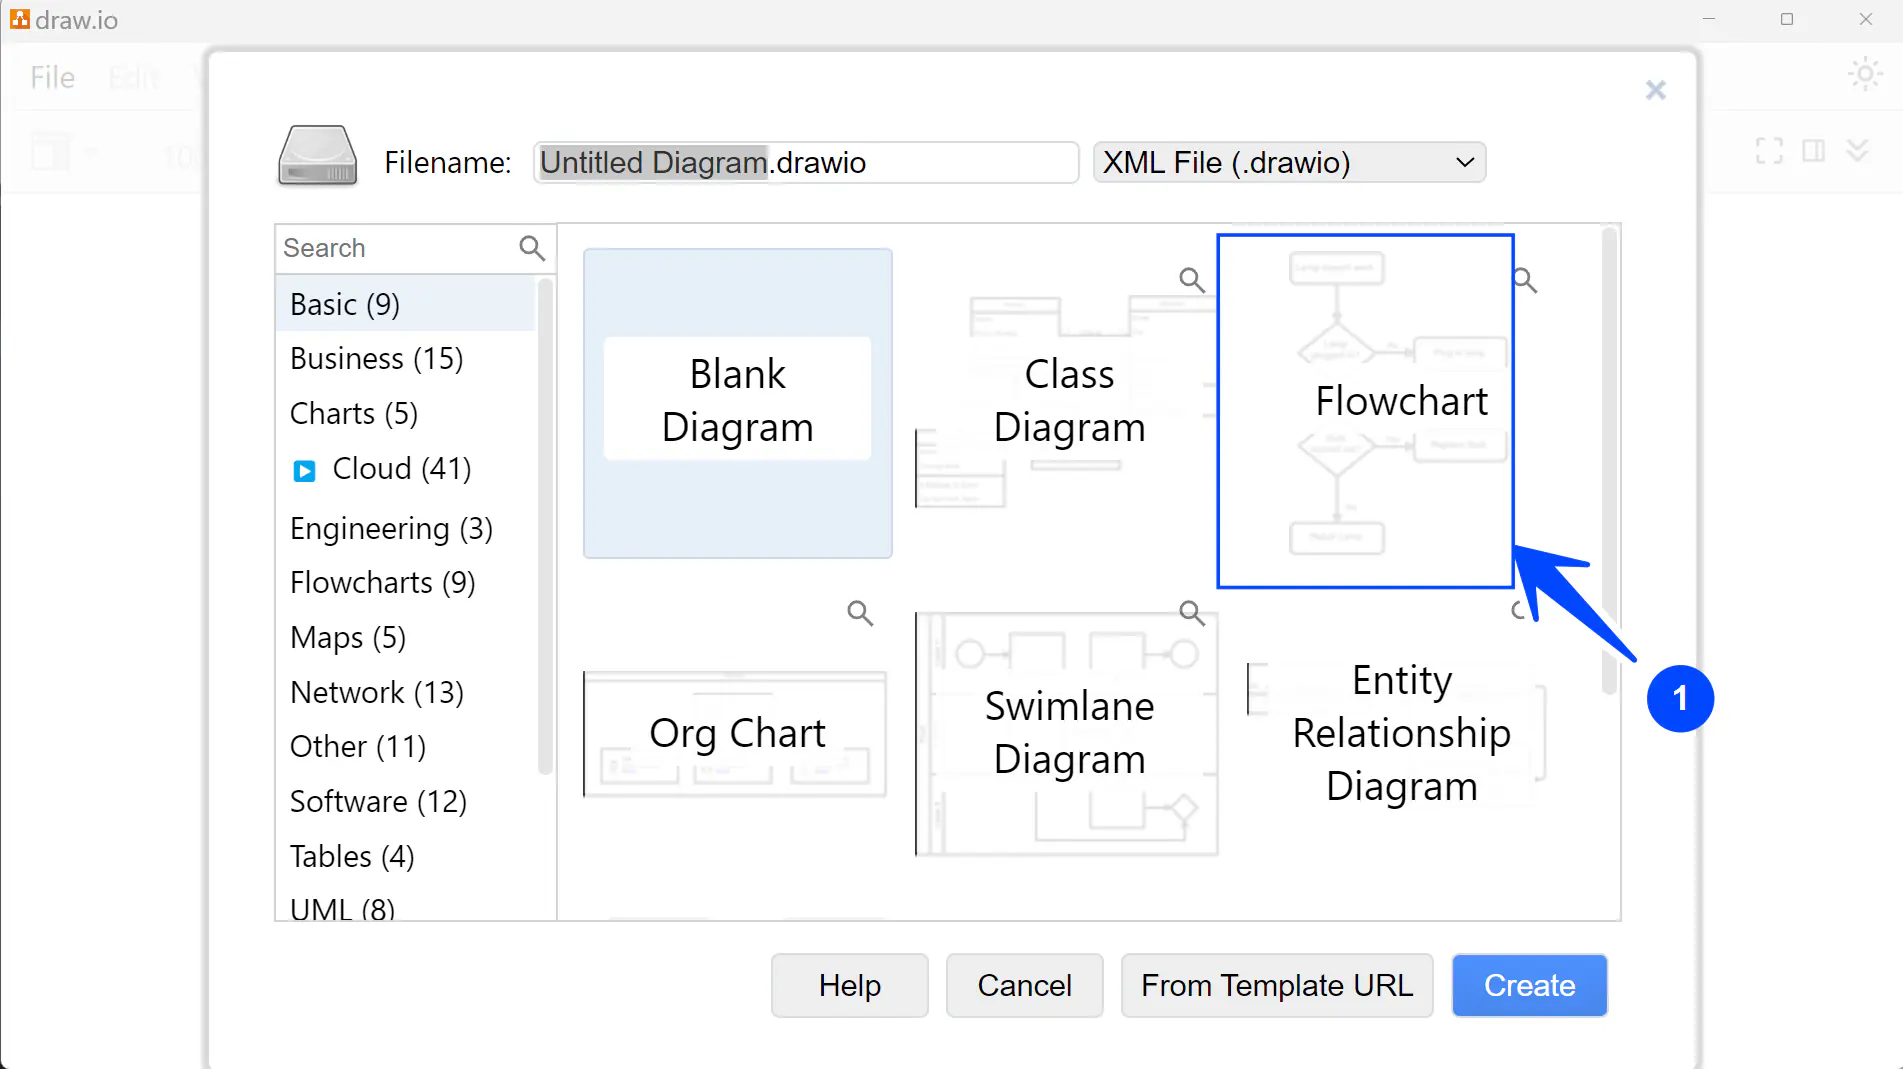
Give a filename to the flowchart and click on the Create button.
Define the Process: Clearly understand the process or algorithm you want to represent. Break it down into individual steps.
Start/End Symbols
Identify Start and End: Determine where the process starts and where it ends. Ovals or rounded rectangles represent start/end symbols. Use standard symbols for flowcharting to ensure clarity and consistency.
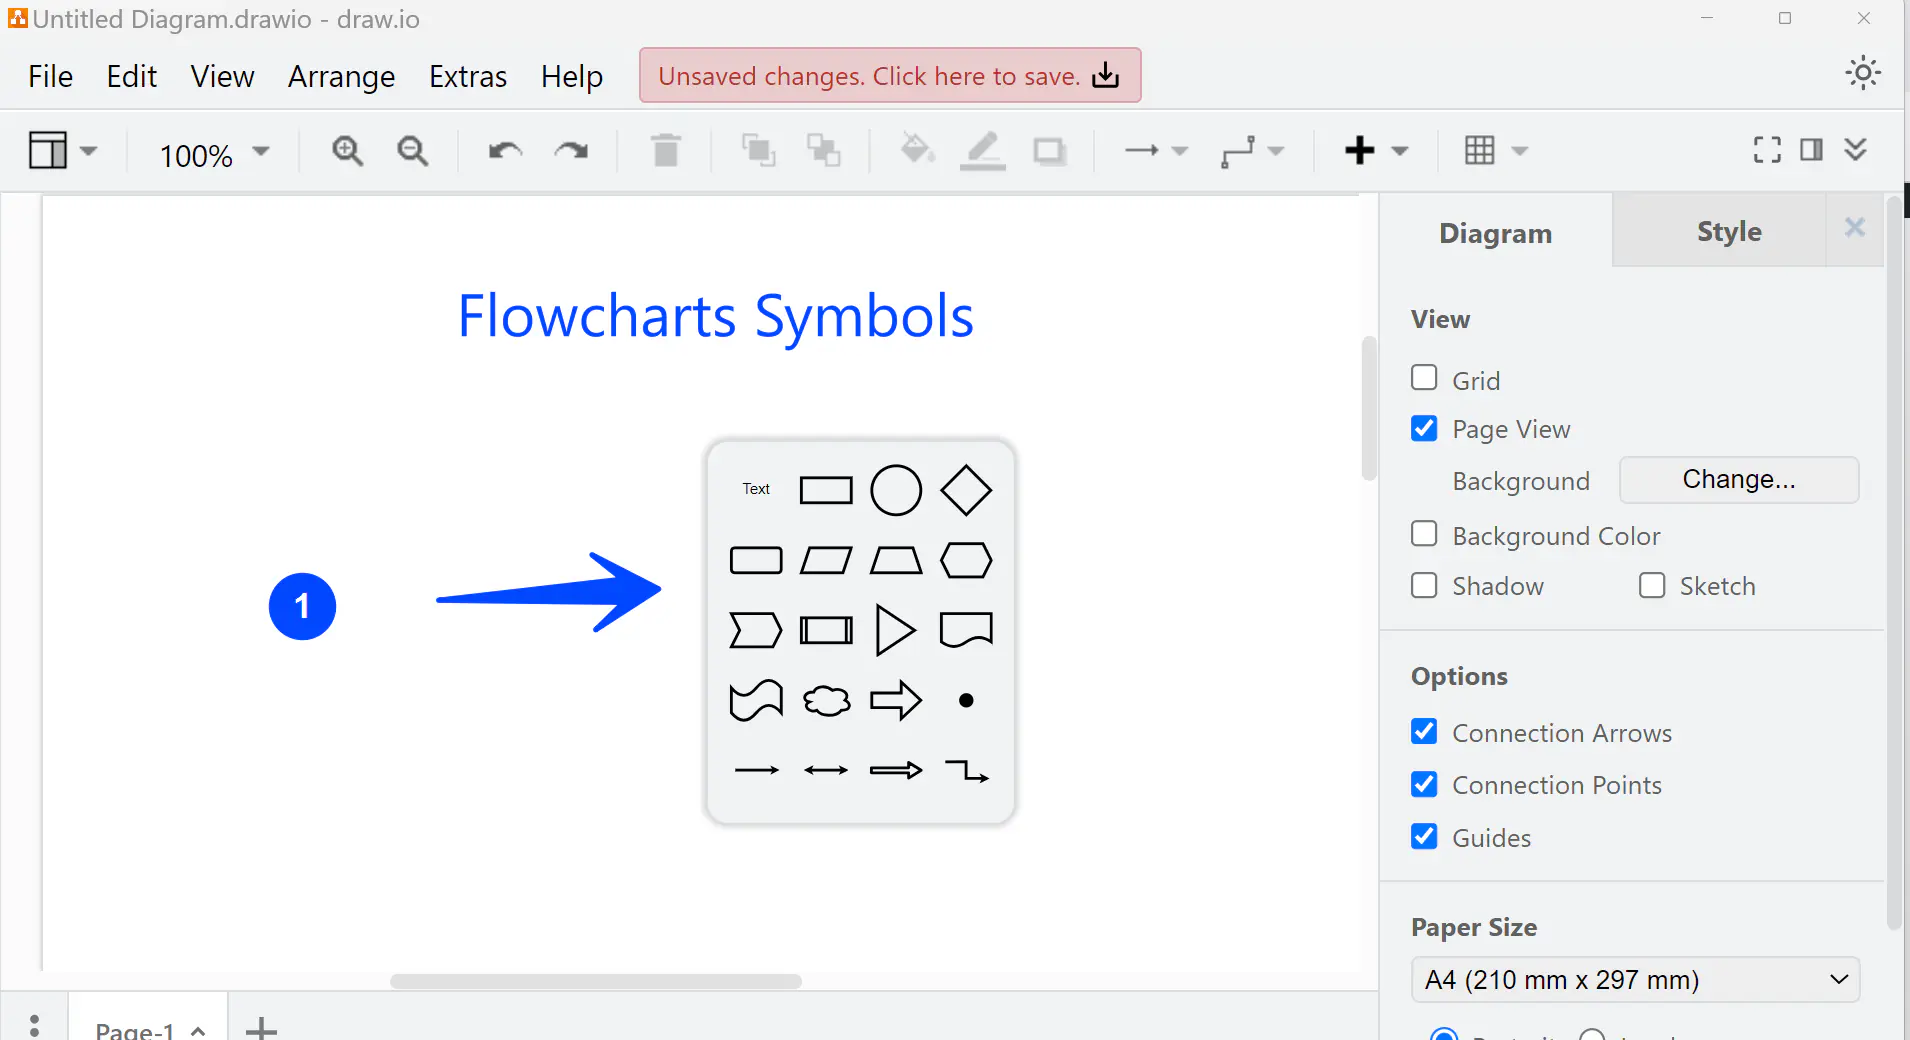
Standard Symbols:
- Oval Symbol: Start/End Point
- Parallelogram: Input/Output
- Rectangle Symbol: Process/Action
- Diamond: Decision
- Arrow Lines: Flow of Control
Double-click the mouse button on the workspace area to add flowchart symbols.
Draw Arrows: Connect the symbols using arrows to represent the control flow. Arrows typically point from one symbol to another, indicating the direction of the flow.
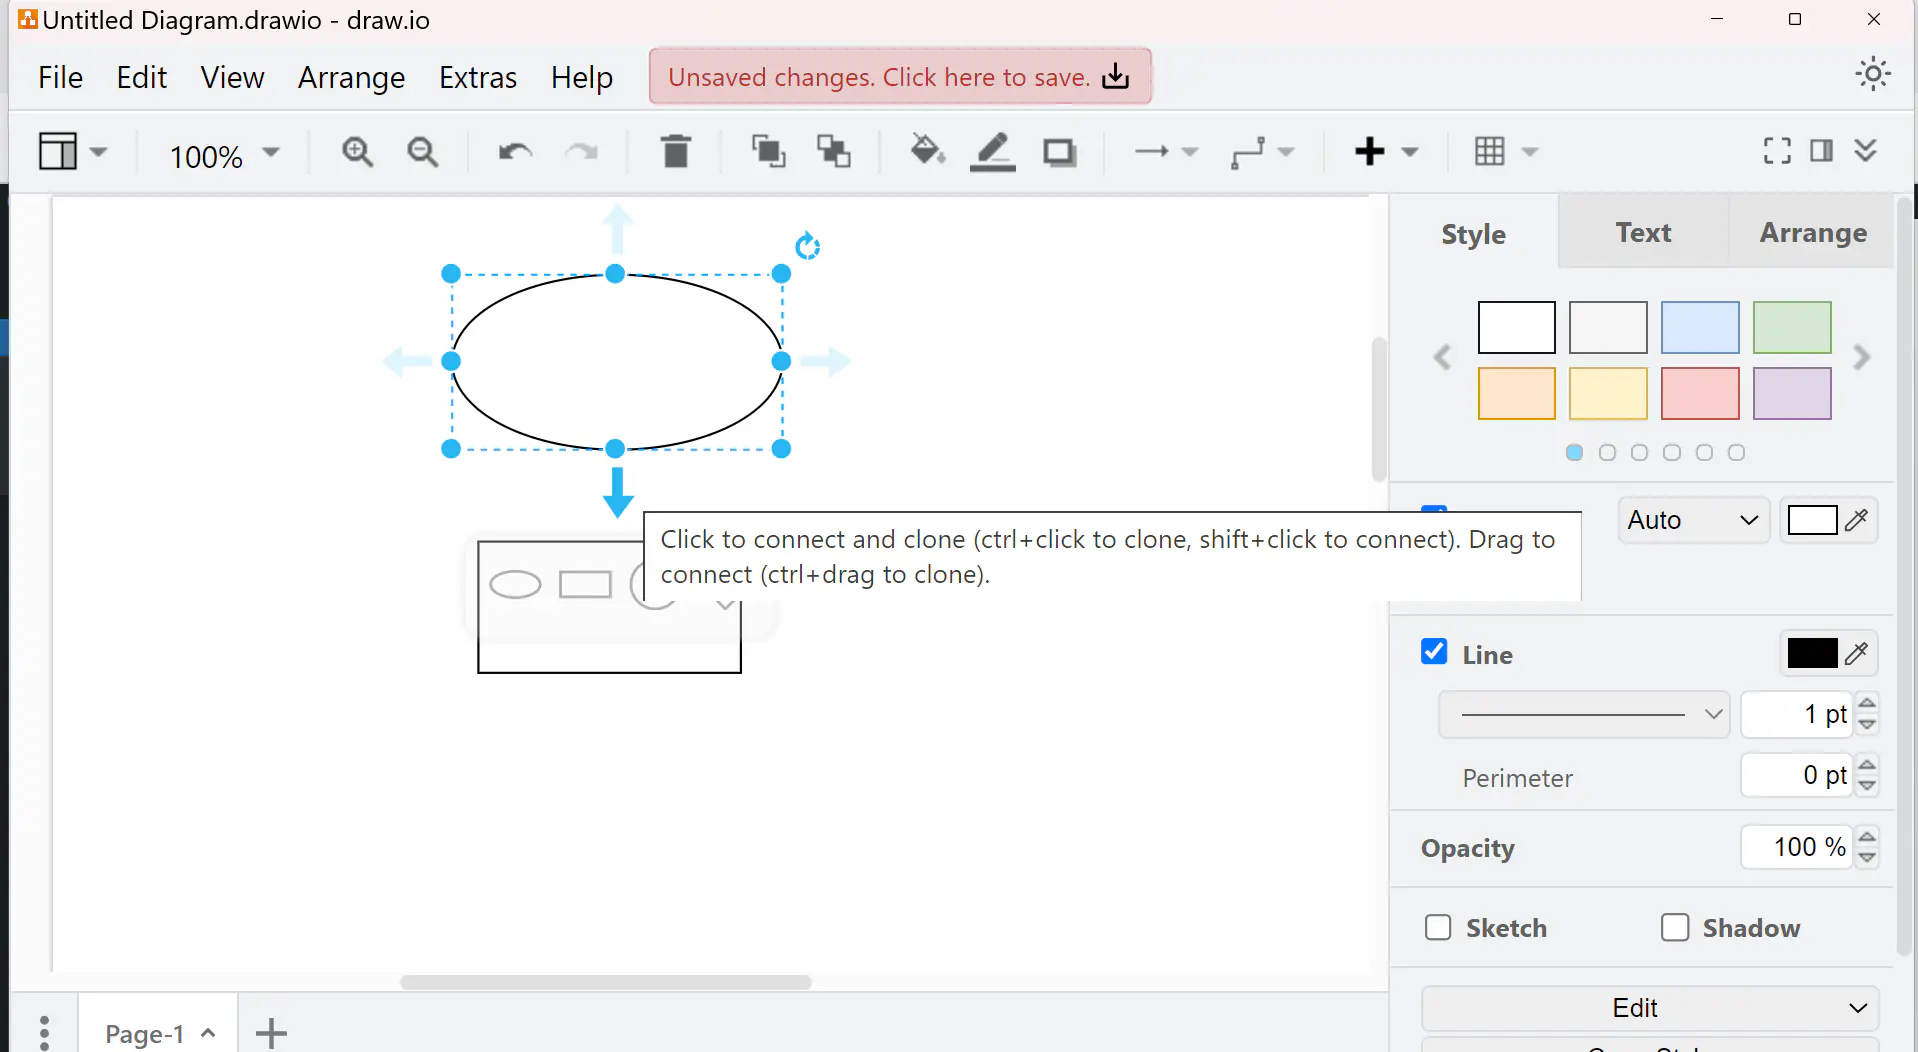
Click on the flowchart symbol and drag to the symbol to connect and show the control flow.
Identify Actions/Operations: Identify the actions or operations performed within the process.
Identify Decision Points: Identify any decision points within the process.
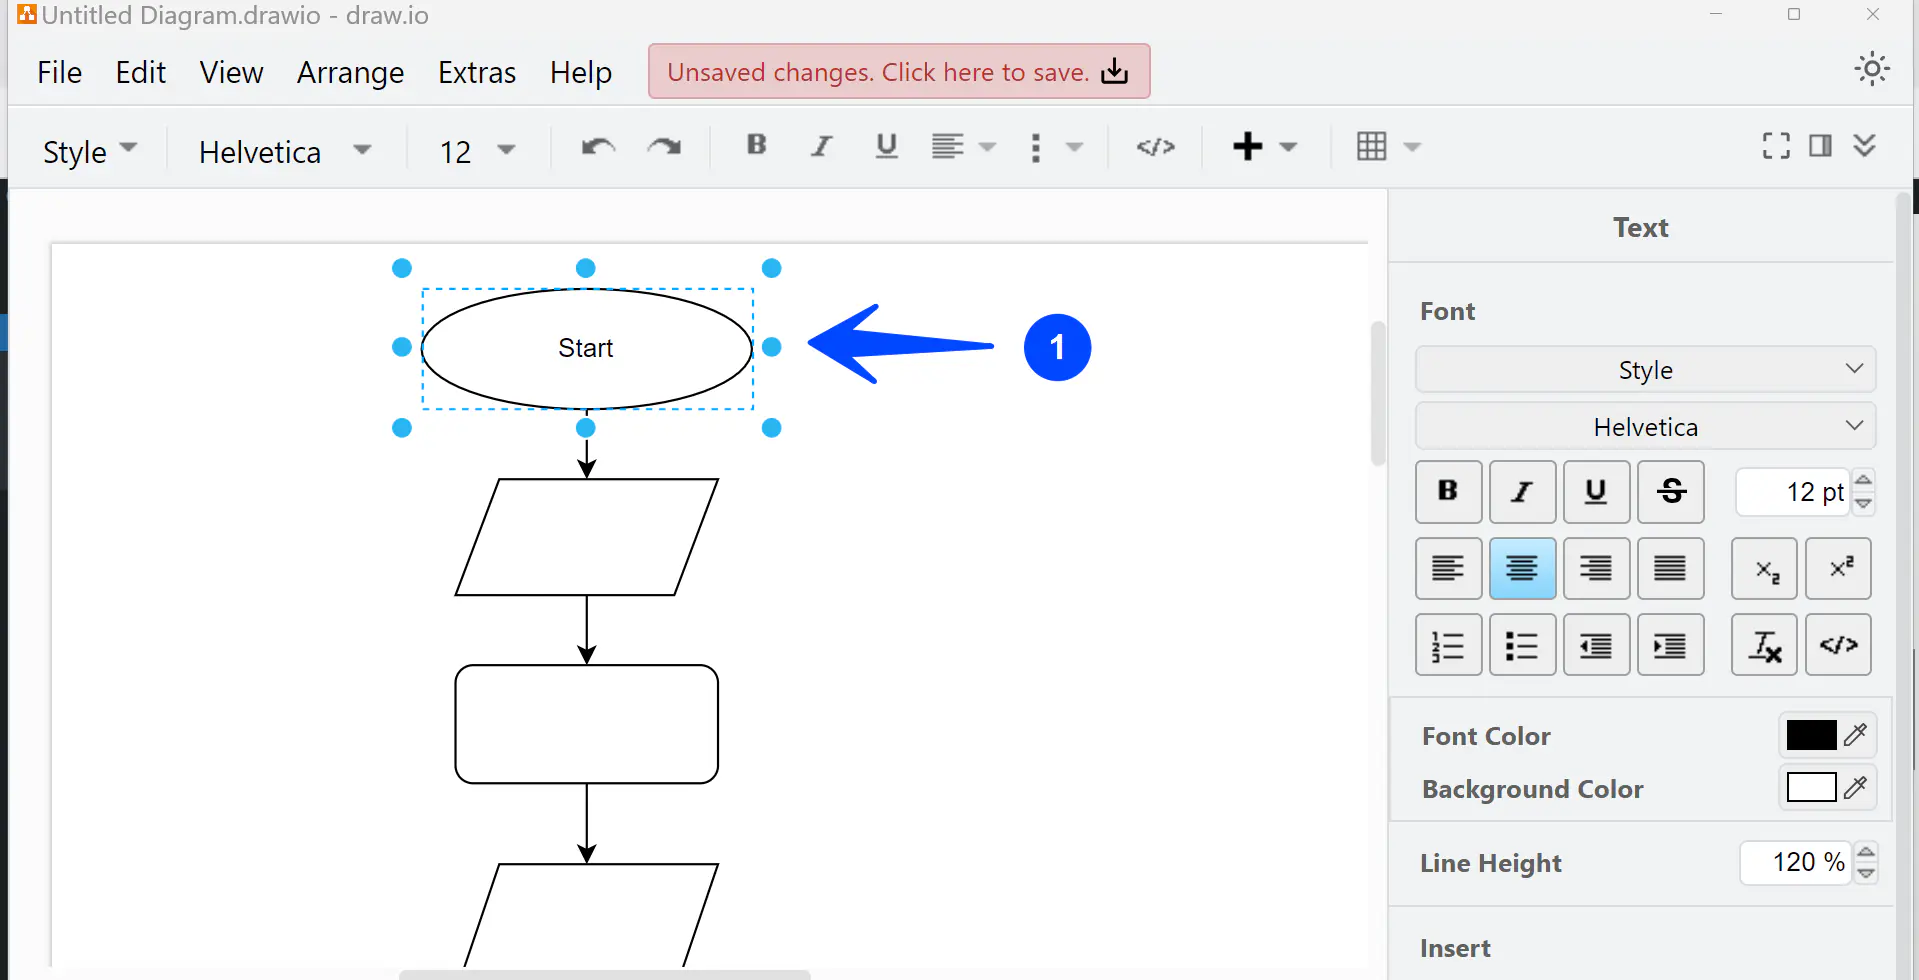
Label Symbols: Label each symbol with a brief description of the action, decision, or process it represents. Double-click on the flowchart symbol to add a label.
Review and Refine: Review the flowchart to ensure it accurately represents the process. Make any necessary adjustments or refinements.
Next Tutorial
Let’s construct a simple flowchart using the above guide. A flowchart to compute the sum of two numbers can be found below:


