

Overview
JConsole is a GUI Java monitoring tool. Using the tool, we can profile JVM and know information about the Java application performance and resource consumption.
Tool Features
We can monitor:
- Heap memory/Non-Heap memory usage
- Number of loaded classes
- Number of Threads
- CPU Usage, etc.
- Perform Garbage collection
The tool can be found under the bin directory of the JDK home directory.
%JAVA_HOME%\bin
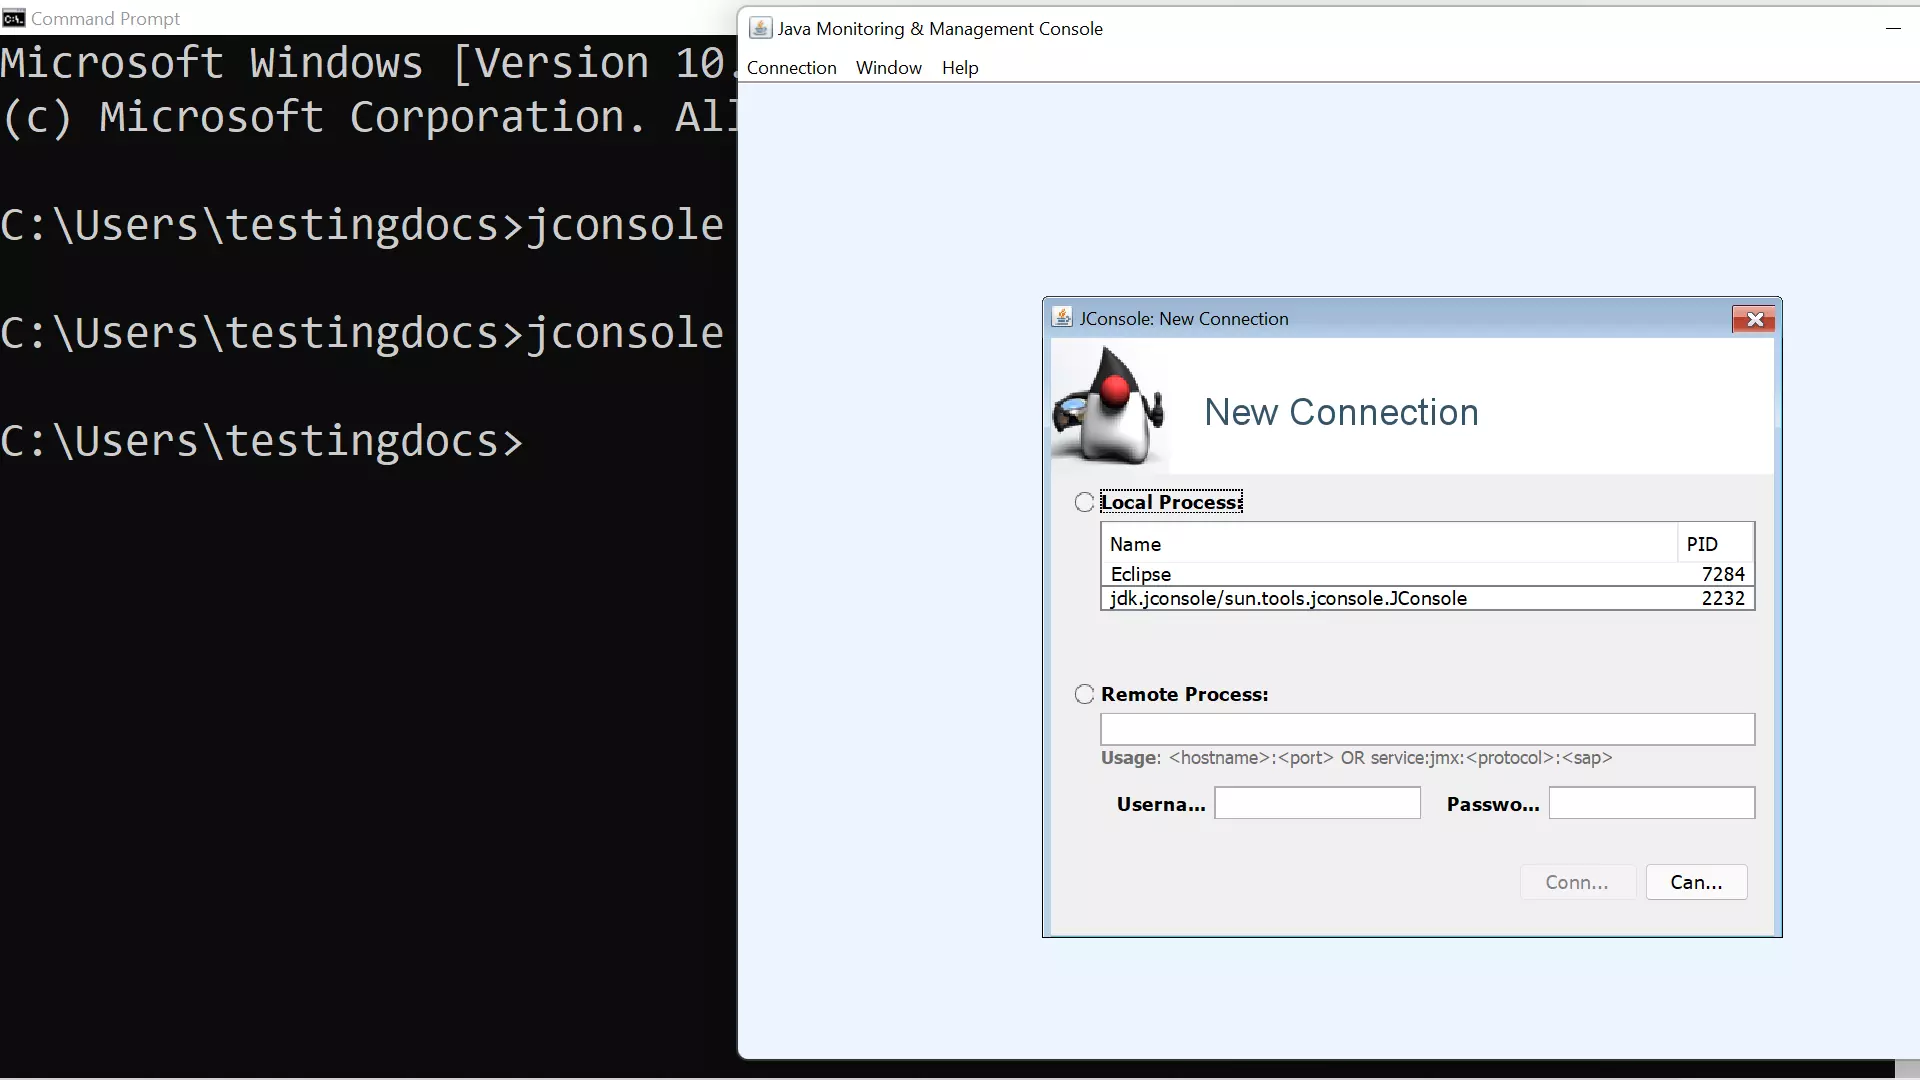
JConsole New Connection
To start the tool, type the following command:(Assuming JDK appended to the PATH environment variable on the machine)
\> jconsole
The new connection window has two options:
- Local Process
- Remote Process
Local monitoring
A local process is used to monitor local Java applications that are running on the local machine.
We can attach JConsole to a local process from the list in the JConsole new connection wizard. Alternatively, we can specify the PID of the local process to attach the JConsole.
\> jconsole pid

Remote monitoring
The remote process is used to monitor remote Java applications that are running on the remote machine. For example, we can connect to the Java applications that are running on the JBoss Application Server machine from the workstation PC.
To start and attach JConsole to a remote process for remote monitoring, we need to use the hostname and the port.
\> jconsole hostname:port
We can also connect to remote JMX agents using the JMX service URL.
JConsole GUI
https://www.testingdocs.com/jconsole-user-interface-overview/
—
Java Tutorial on this website:
https://www.testingdocs.com/java-tutorial/
For more information on Java, visit the official website :