

Introduction
JConsole is a Java monitoring tool and management console. In this tutorial, we will learn JConsole User Interface.
https://www.testingdocs.com/jconsole-java-monitoring-management-console/
JConsole User Interface
The tool has several tabs to monitor different aspects of the Java application.
- Overview
- Memory
- Threads
- Classes
- MBeans
- VM Summary
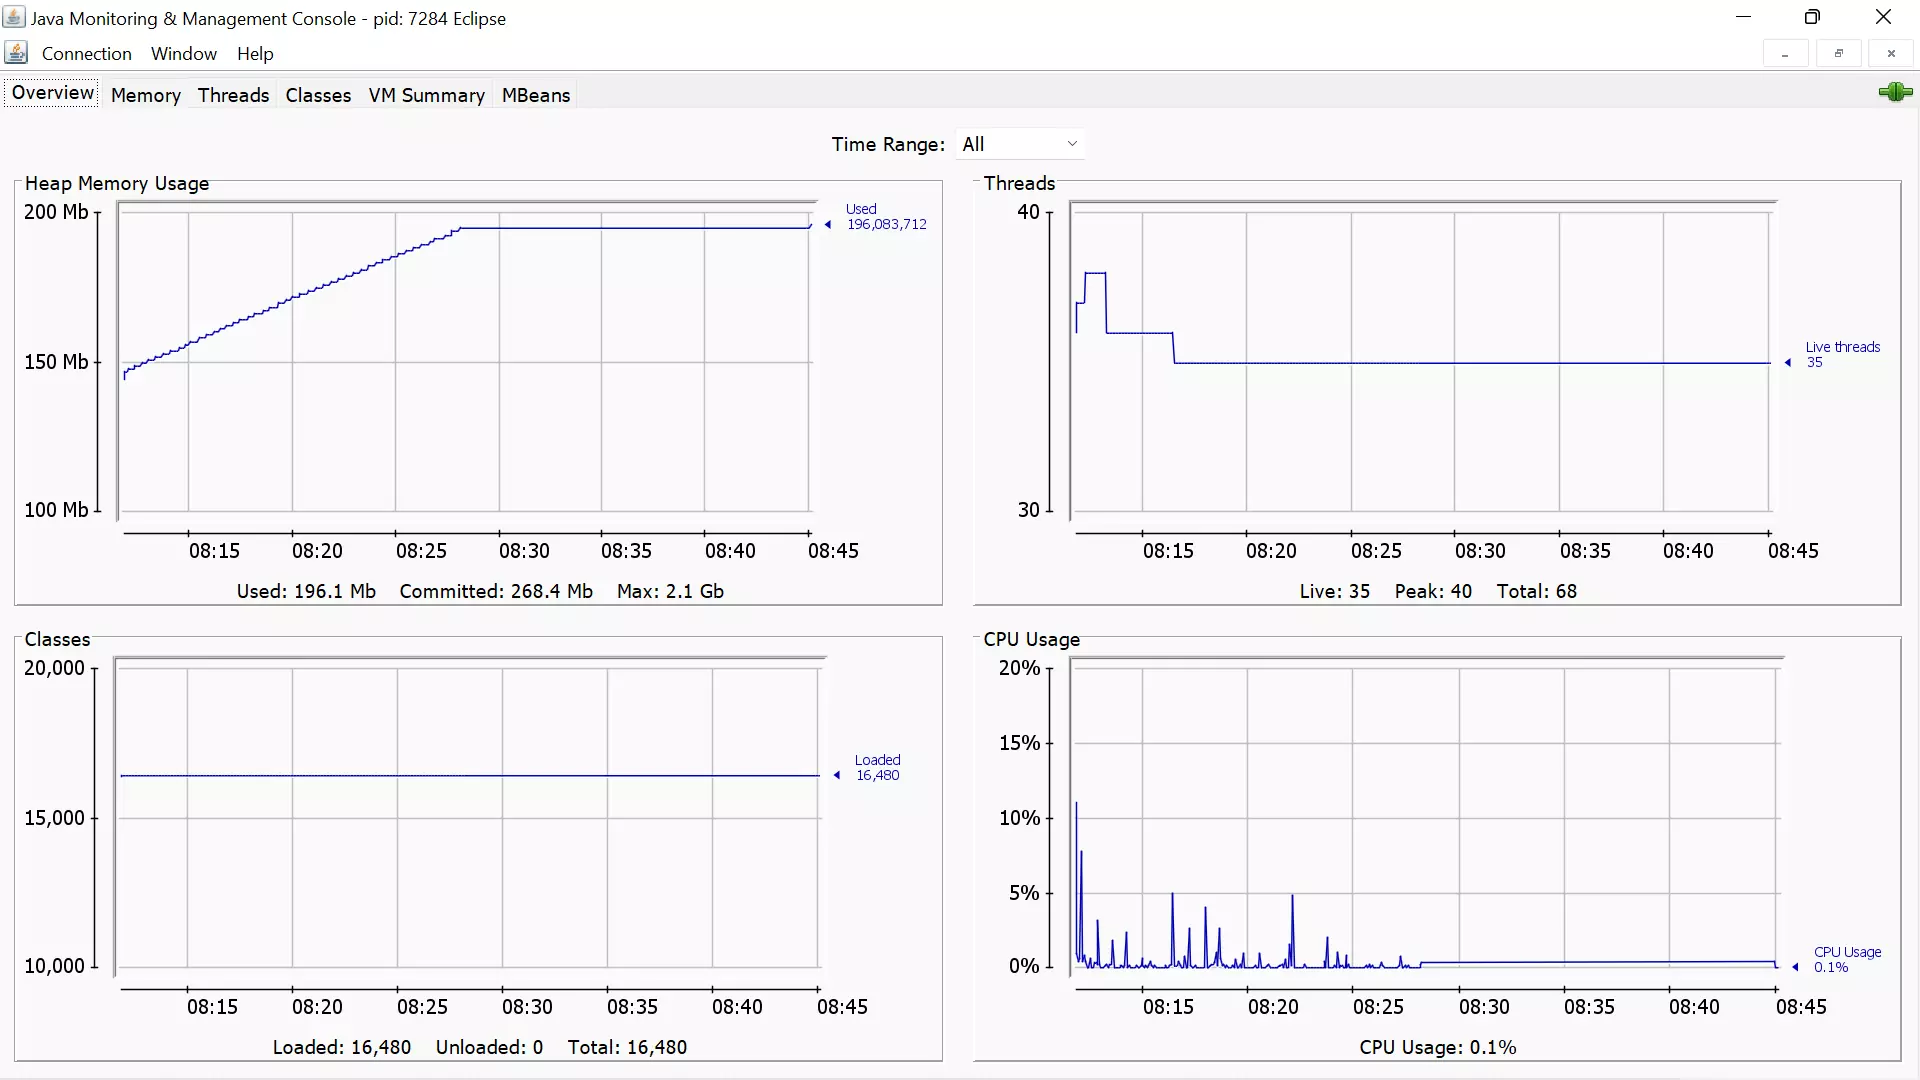

The Overview tab displays the overall information about the monitored JVM. It consists of Memory, Classes loaded, Threads count and CPU usage graphs.
Memory
Memory tab displays the memory usage of the VM. We can use the Chart dropdown to select the Heap memory usage, Non-Heap memory usage, and several memory pools.
To perform Garbage collection click on the Perform GC button.
Threads
Threads tab display information about the Number of Threads. The graph shows the Live threads with a Peak thread count.
We can also detect deadlocks in this tab. Click on the Detect Deadlock button to detect deadlocked Threads.
Classes
The Classes tab displays information about the loaded classes. The information includes:
- Number of loaded classes
- Total Classes loaded
- Unloaded classes
VM Summary
This tab displays the overall JVM summary. Some of the information that is displayed on this tab are:
- Connection Name
- JVM
- JVM Vendor
- Uptime
- JIT Compiler Information
- VM Arguments
- Classpath
Time Range
We can pick the time range from the Time Range dropdown. The time range options are last All, 12 hrs, 1 day, 7 days, 1 month, etc.
—
Java Tutorials on this website:
https://www.testingdocs.com/java-tutorial/
For more information on Java, visit the official website :