

Overview
In this tutorial, we will learn about the Octave plot command with examples. The plot command is the basic command to generate 2D plot in Octave.
Syntax
The basic syntax for the command is:
plot(x,y)
Optionally, we can provide many options to the command:
plot(x,y,[options])
x and y are coordinates scalars or vectors. When the x and y are scalars the command plots a single point. If x and y are vectors the command plots all the points joining them with straight lines in a figure window.
The x, y vectors must be of the same length. An error will occur if the vectors are not the same length.
Example
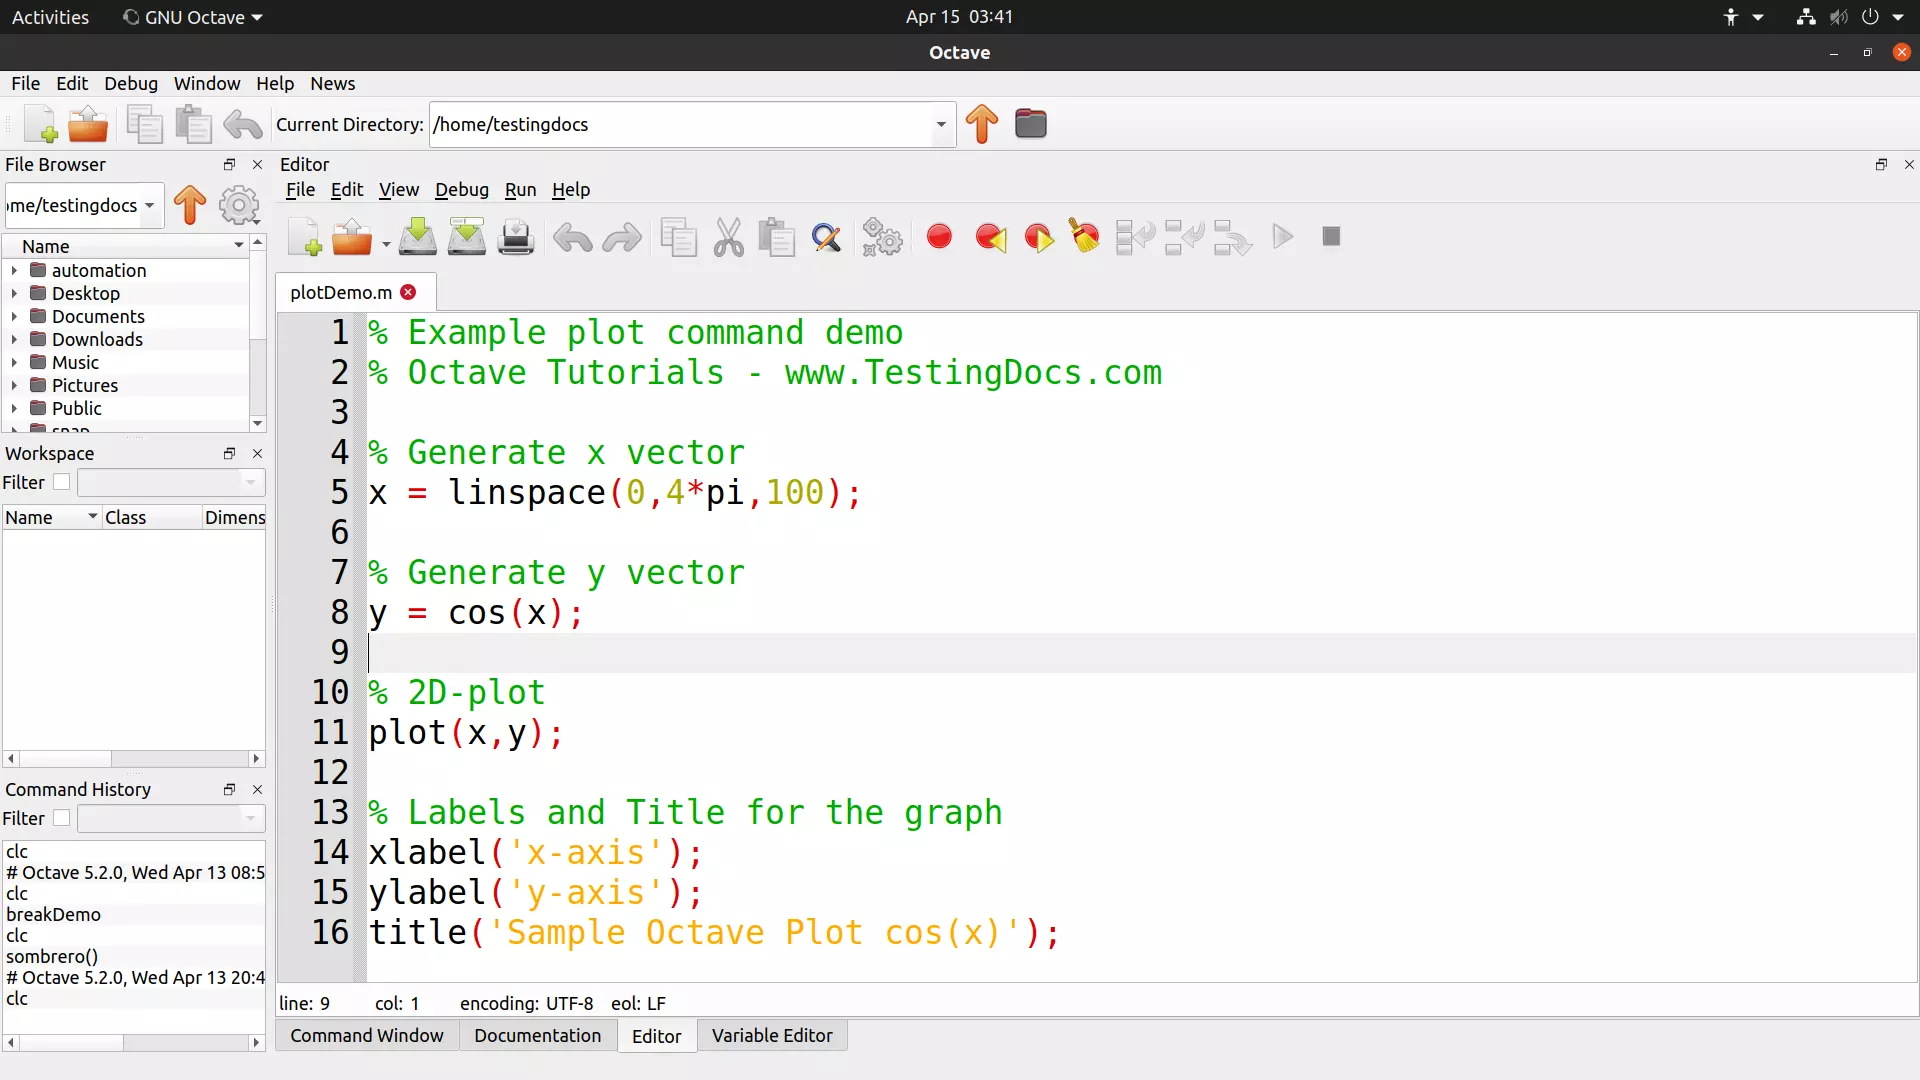
% Example plot command demo
% Octave Tutorials - www.TestingDocs.com

clear all;
clf;

% Generate x vector
x = linspace(0,4*pi,100);

% Generate y vector
y = cos(x);

% 2D-plot
plot(x,y);

% Labels and Title for the graph
xlabel('x-axis');
ylabel('y-axis');
title('Sample Octave Plot cos(x)');

clear all;
This command clears all the existing variables from the workspace. The practice of clearing the workspace at the start is highly recommended. It also frees up the system memory.
clf;
This command clears the current figure window.
linspace
linspace is a built-in function. The function returns a row vector with N linearly spaced elements between the START and the END.
linspace (START, END, N)
xlabel(‘string’);
The xlabel command will display the label along the x-axis in the figure.
ylabel(‘string’);
The ylabel command will display the label along the y-axis in the figure.
title(‘string’);
The title command will display the title for the figure.
Screenshot
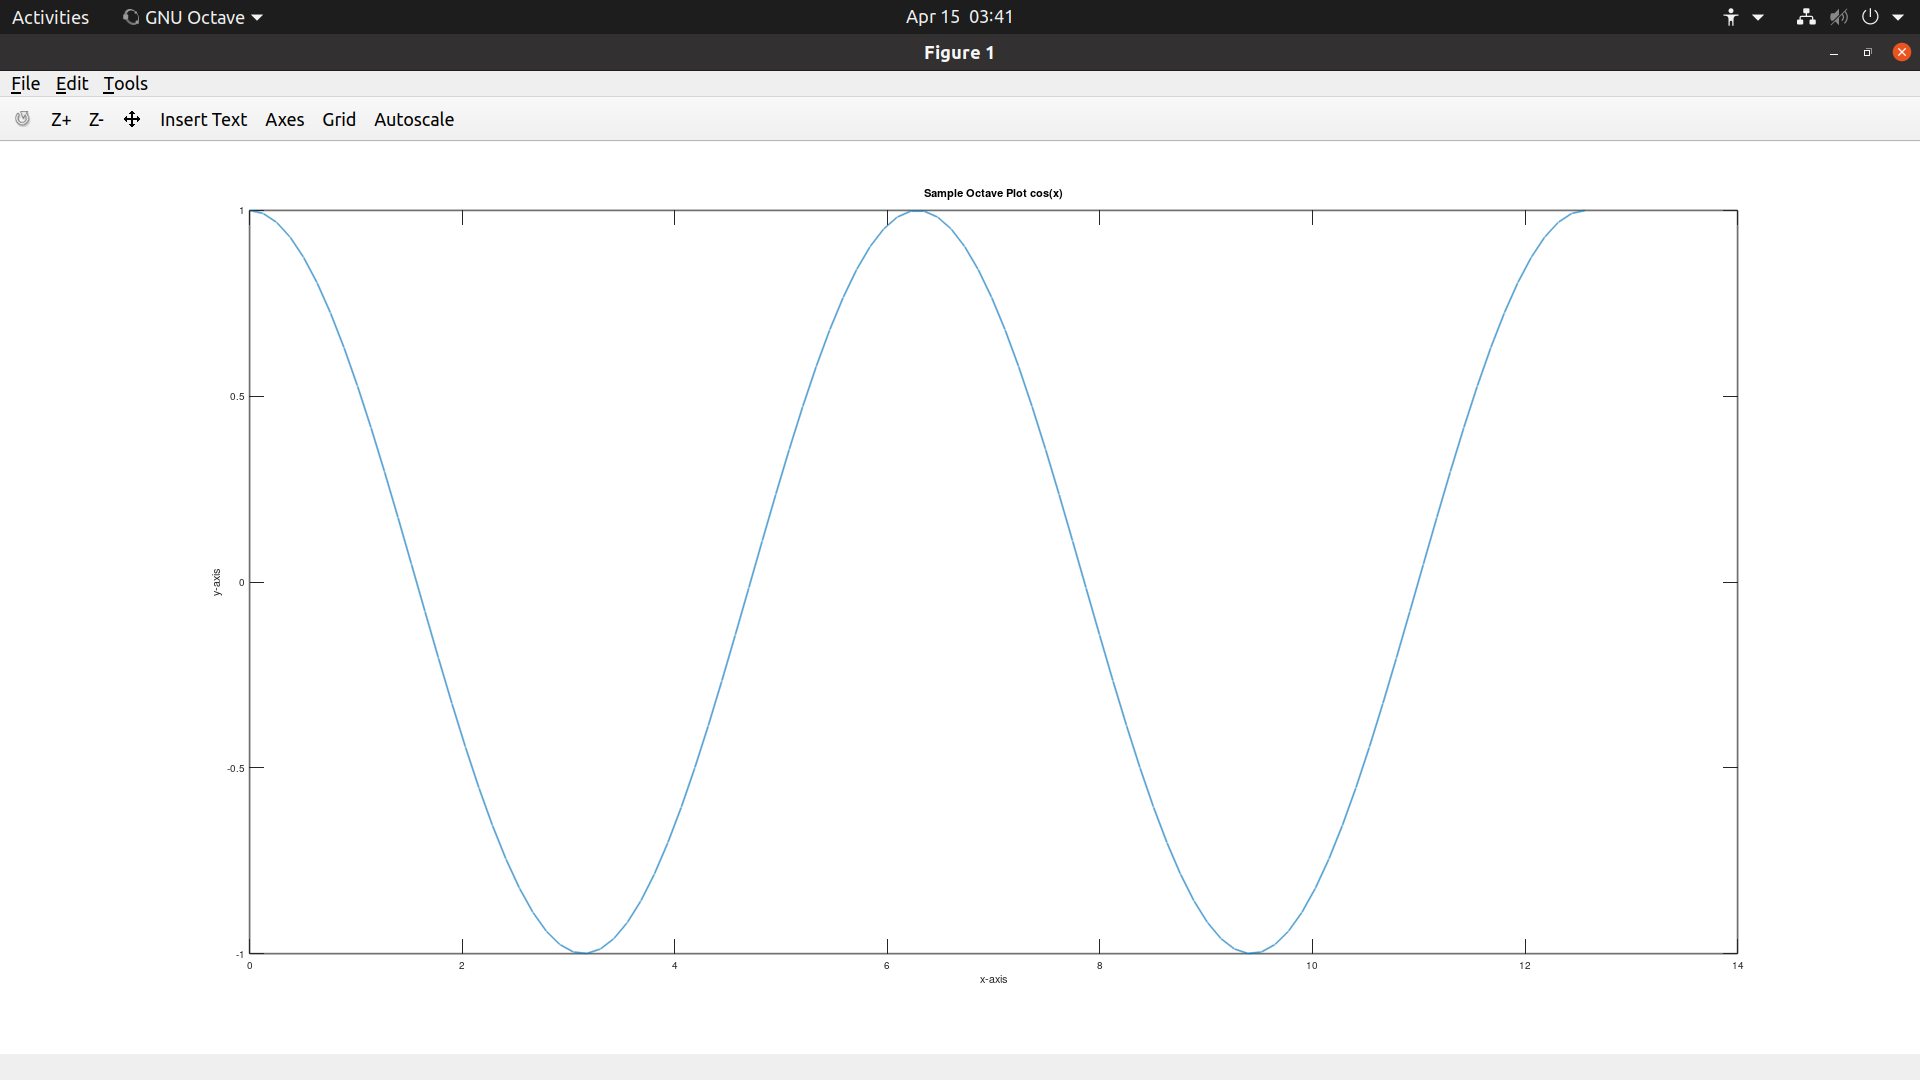
plot
The plot command is used to create the plot. The default style of plotting in Octave is a thin blue line to connect the points. To change the appearance of the plot, we can add another argument to the plot command.
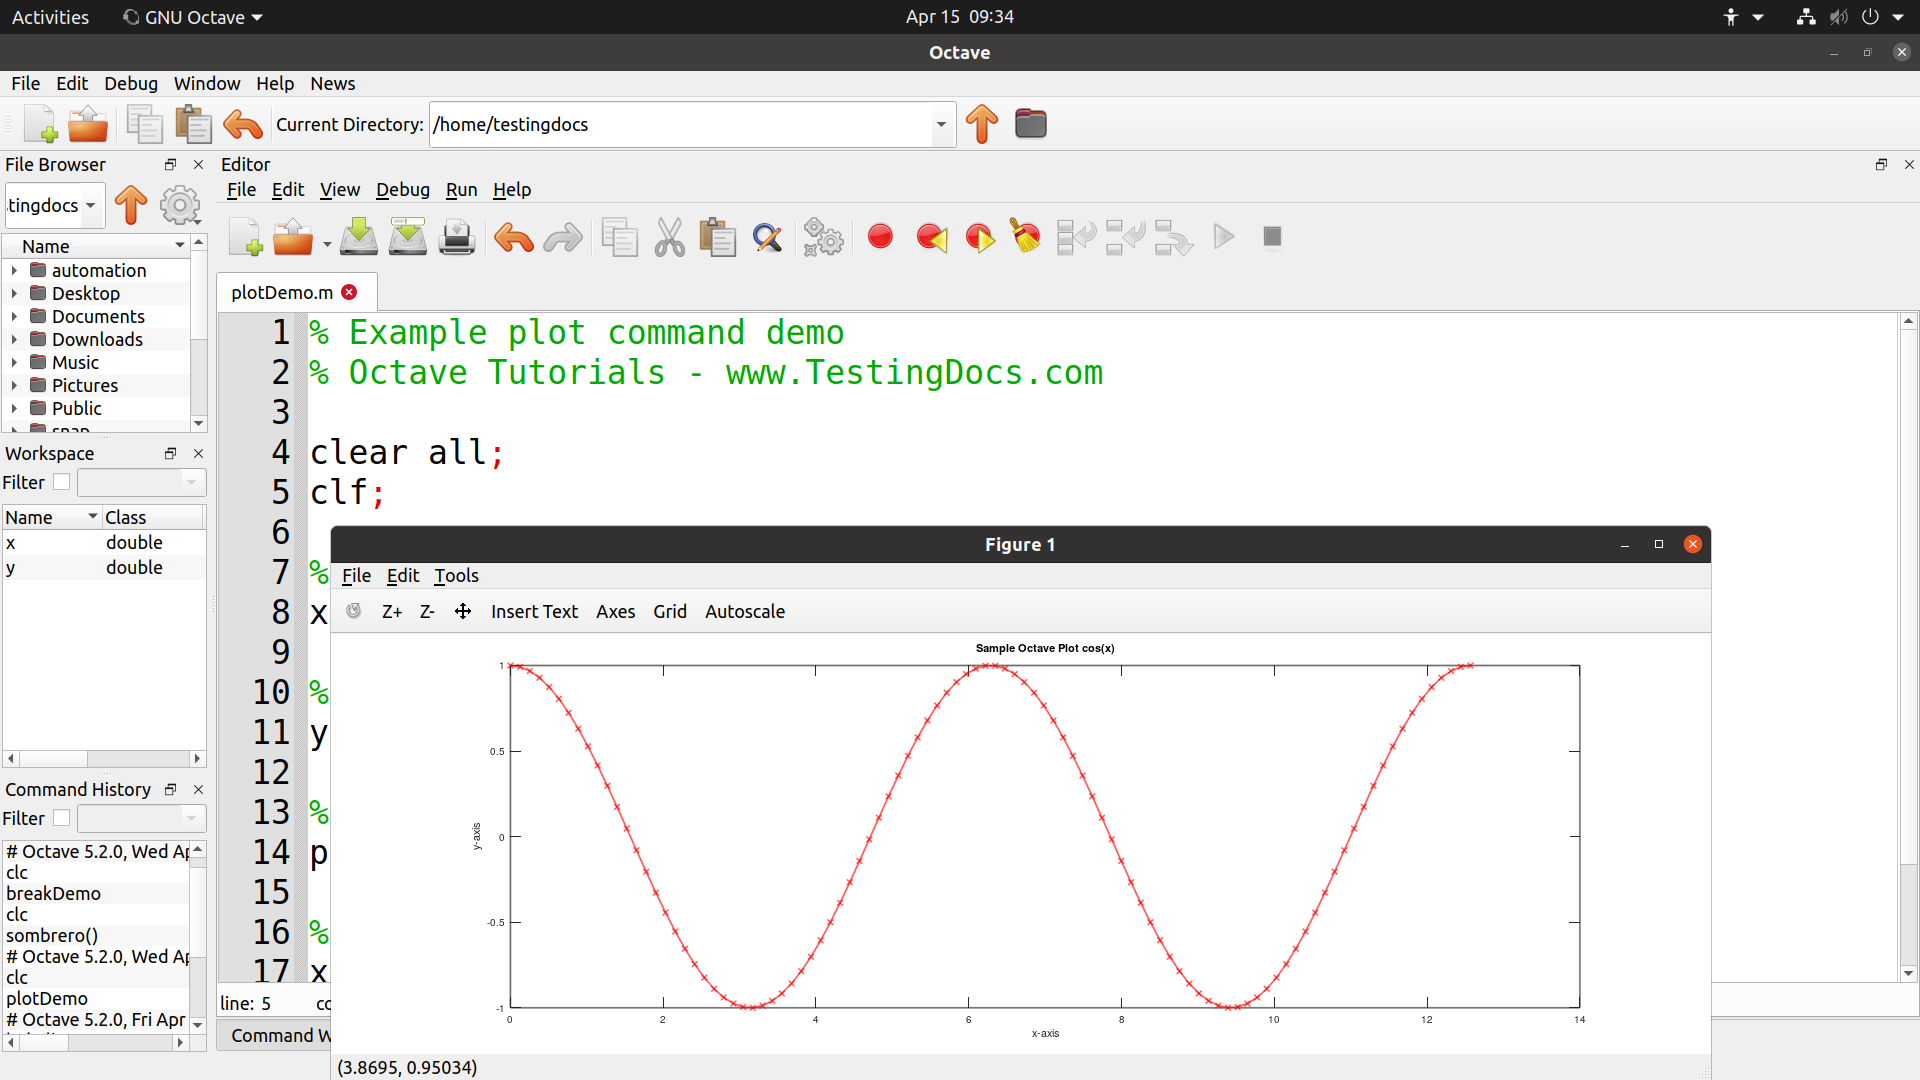
For example, to change the plot to appear as a thin red line with x marks:
plot(x,y,’r-x’)
hold on;
This command will allow us to plot multiple plots within the same figure window.
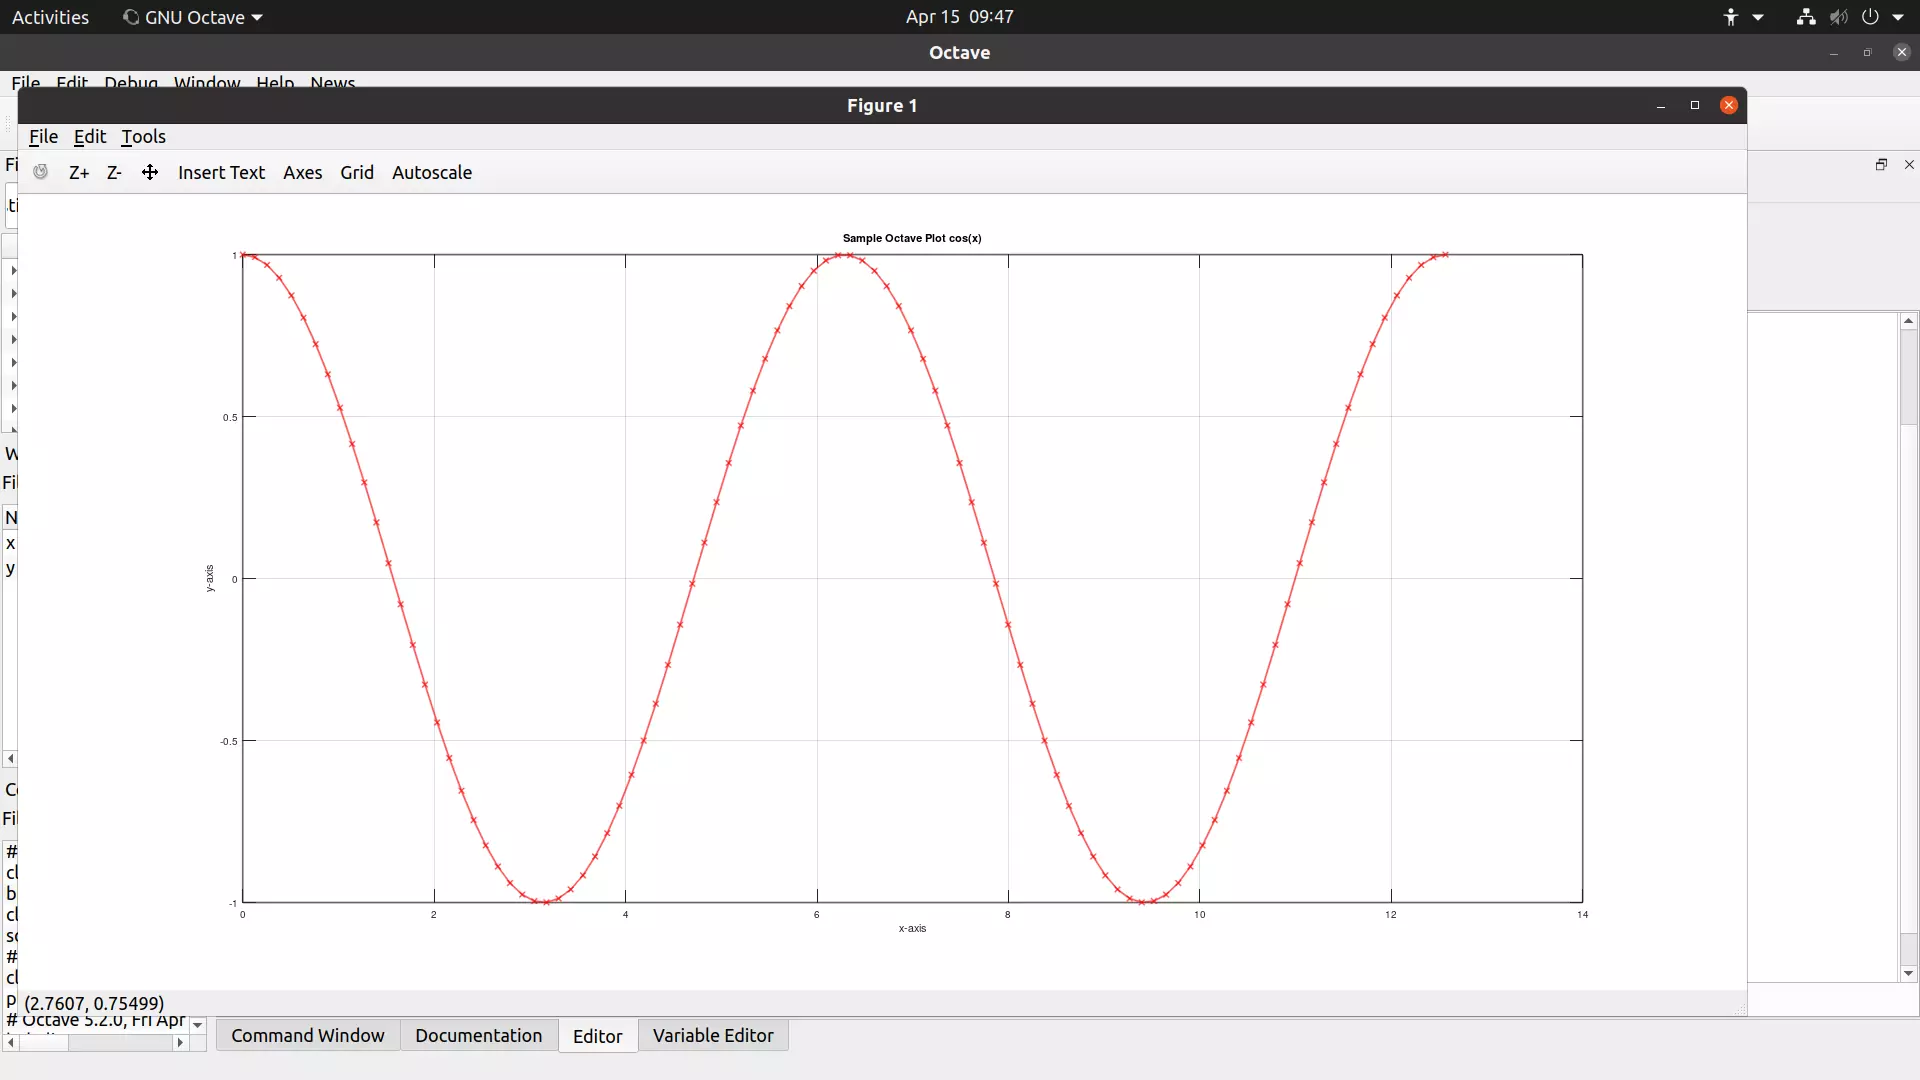
grid on;
The grid command will make a grid appear in the figure window.
—
Octave Tutorials
GNU Octave Tutorials on this website can be found at:
https://www.testingdocs.com/octave-tutorial/
For more information on Octave, visit the official website:
https://www.gnu.org/software/octave/index