

Introduction
In this tutorial, we will go through the steps involved to write a simple script to plot data using the Octave application. Let’s take a sample function

or

Plot example
All the script commands should be placed in a file with .m extension. To create a script file
Editor >> File >> Save File >> <filnename>.m
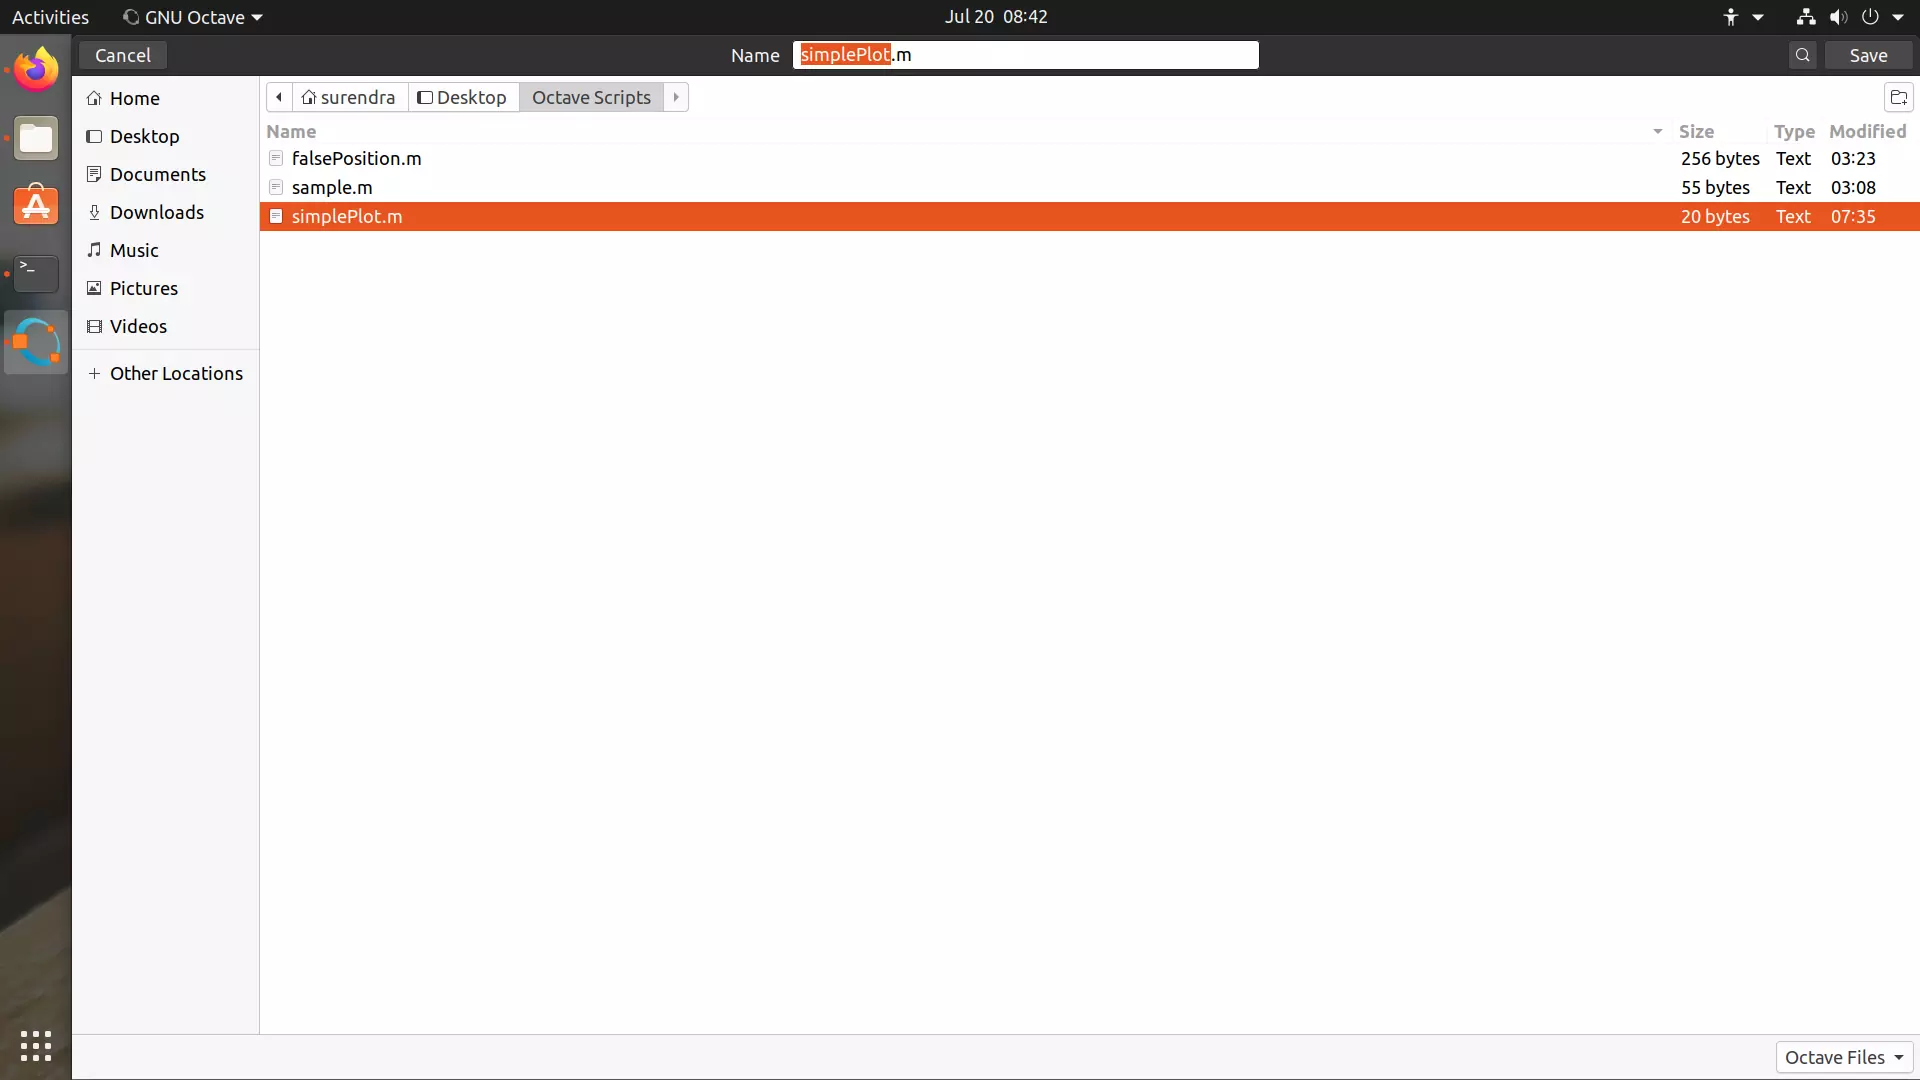

Give a name to the script file and save the file.
Add the script code.
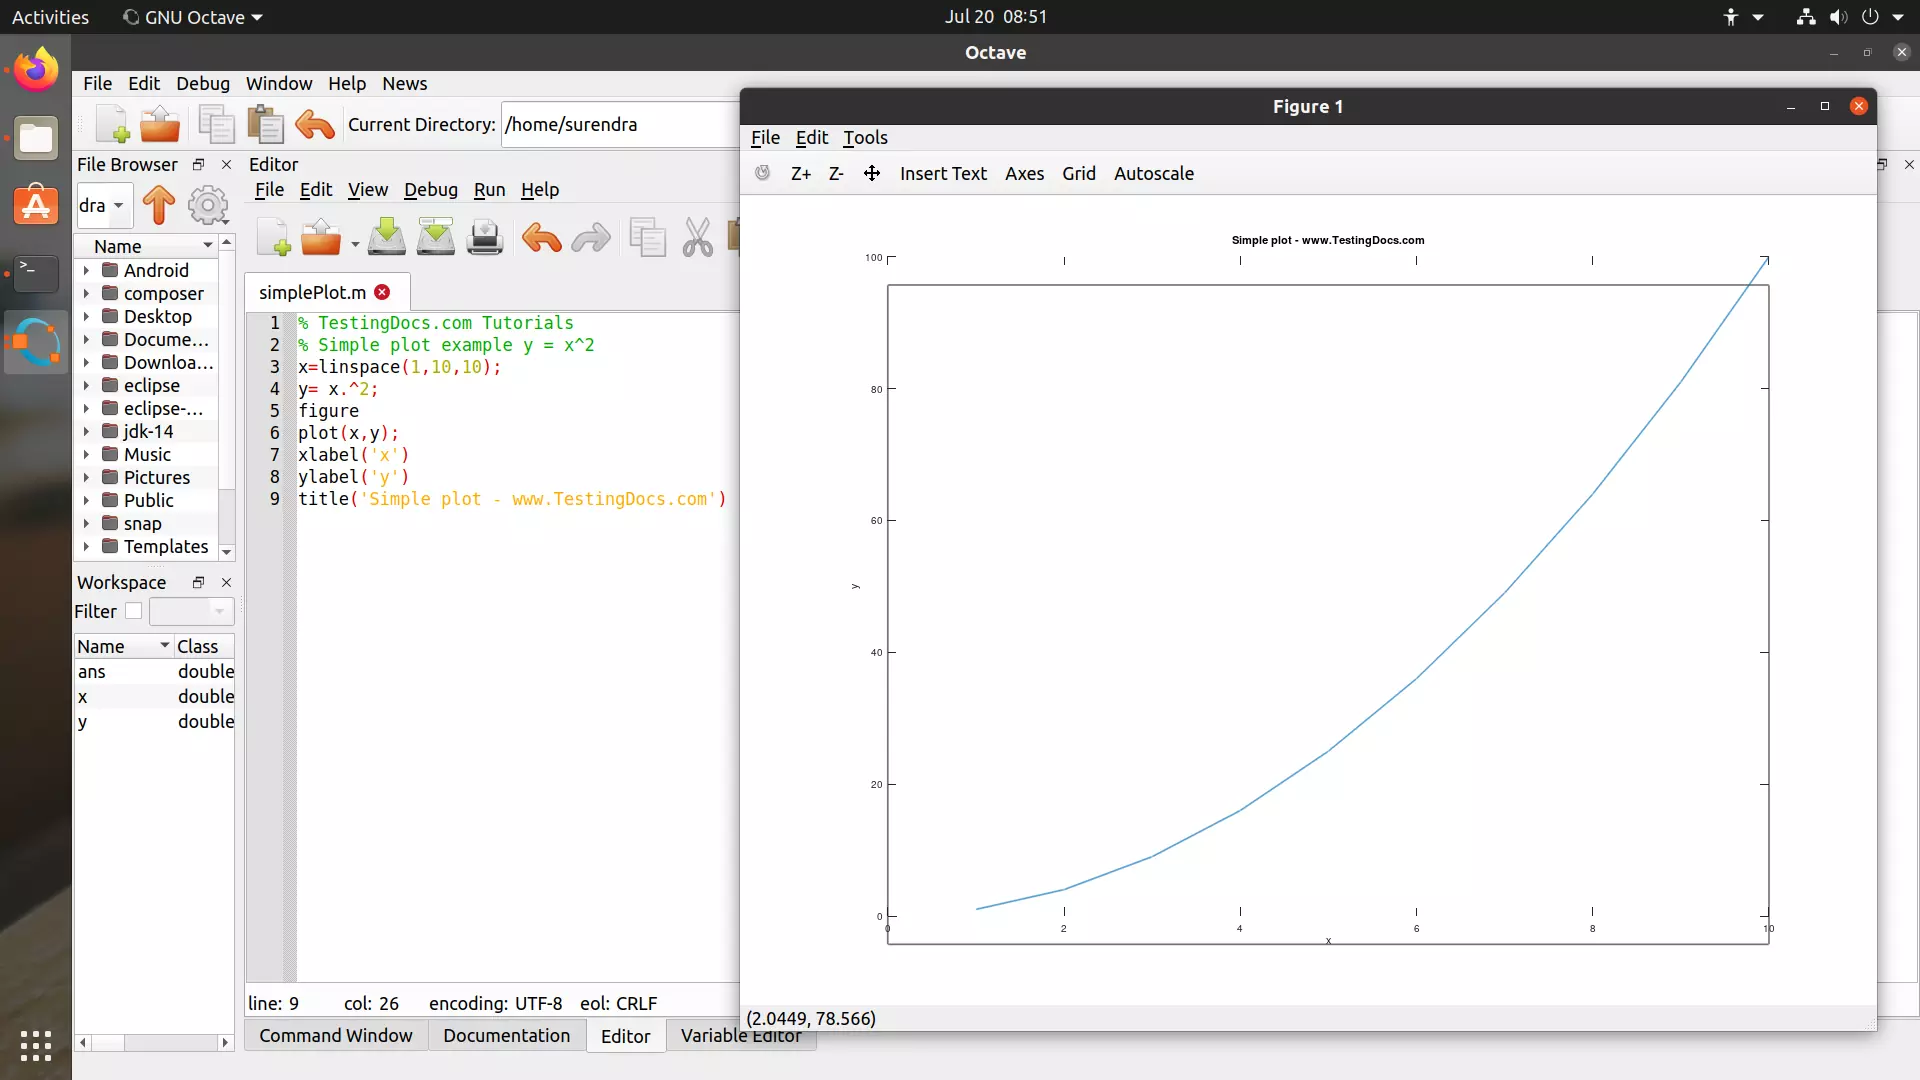
Script
% TestingDocs.com Tutorials
% Simple plot example y = x^2
x=linspace(1,10,10);
y= x.^2;
figure
plot(x,y);
xlabel('x')
ylabel('y')
title('Simple plot - www.TestingDocs.com')
linspace
linspace is a built-in function that returns a row vector with n linearly spaced elements between the specified interval parameters.
—
Octave Tutorials
Octave Tutorial on this website can be found at:
https://www.testingdocs.com/octave-tutorial/
More information on Octave can be found on the official website:
https://www.gnu.org/software/octave/index