

Introduction
In this tutorial, we will learn how to plot a Pie chart using MATLAB. A sample script using the pie() command.
pie(V) 2D plots the pie chart using the data in V. The 3D version of the command is pie3.
legend adds the legend for the plotted pie chart. We can specify the labels for the chart.
Sample Script
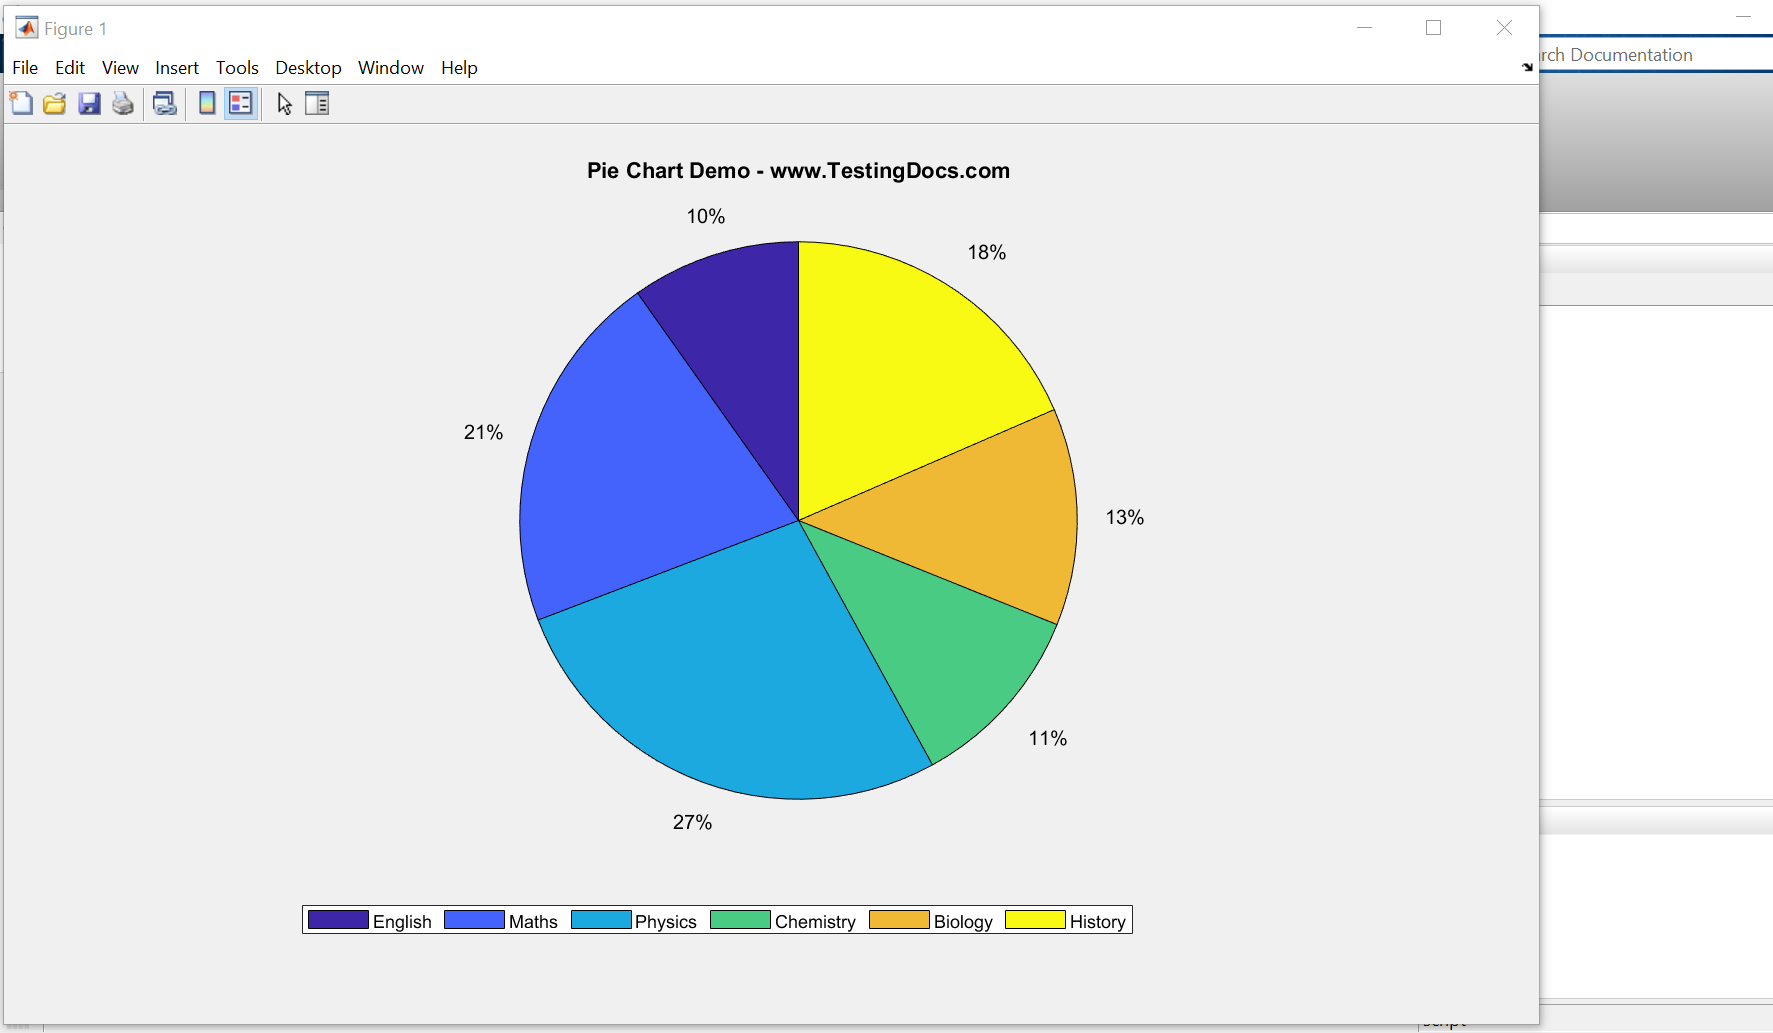
A sample script to plot Pie chart. The data used is student subject marks in each of the subjects. The legend labels for the plot are the subjects.
% Sample Matlab Script for Pie Chart
% www.TestingDocs.com - MATLAB Tutorials
% Clean the Matlab Environment
clc
clear
close all

% Sample Student marks data vector for the Pie chart
pieData = [35 75 97 39 45 66];

% Generate the Pie Chart
pie(pieData);
% Title to the Pie Chart
title('Pie Chart Demo - www.TestingDocs.com');
% Legend to the Pie Chart
subjects = {'English','Maths','Physics','Chemistry','Biology','History'};
legend(subjects,'Location','southoutside','Orientation','horizontal')
Screenshot
Run the script to view the pie chart.
Click on the Editor >> Run green run button from the toolstrip.

MATLAB Tutorials on this website can be found here:
https://www.testingdocs.com/matlab-tutorial/
To try MATLAB Software or to learn more about MATLAB,
MATLAB official website: