

Introduction
Let’s design a flowchart to find the average of two numbers in this tutorial. The flowchart will prompt the user to enter the two numbers. The flowchart would calculate the average of the numbers.
We would be using the Raptor flowchart interpreter for modeling the flowchart.
Raptor Tutorial
Raptor Tutorials on this website can be found at:
https://www.testingdocs.com/raptor-a-flowchart-tool/
RAPTOR official website: https://raptor.martincarlisle.com/
IPO chart
Consider modeling an IPO chart for the flowchart before the flowchart design. Think about the input to the flowchart, processing statements, and the output of the flowchart. IPO chart is a handy tool to visualize in a tabular format.
| Input | Process | Output |
| Input to the flowchart. | Computations that are done in the flowchart. | Output displayed by the flowchart |
Flowchart
Adding input and output symbols to the flow chart:
https://www.testingdocs.com/raptor-flowchart-basics-input-and-output/


We have used two predefined functions is the flowchart.
- Clear_Console
- Set_Precision
Clear_Console clears the master console before the execution of the flowchart. Any previous run outputs in the console would be cleared.
Set_Precision(digits) will set the output values to the supplied number of significant places after the decimal.
Output
Let’s run the flowchart with sample test cases to verify that it’s working as intended. If you find that the flowchart is not working as intended in the testing, we may need to verify and debug the flowchart.
Debugging a flowchart: https://www.testingdocs.com/debugging-a-raptor-flowchart/
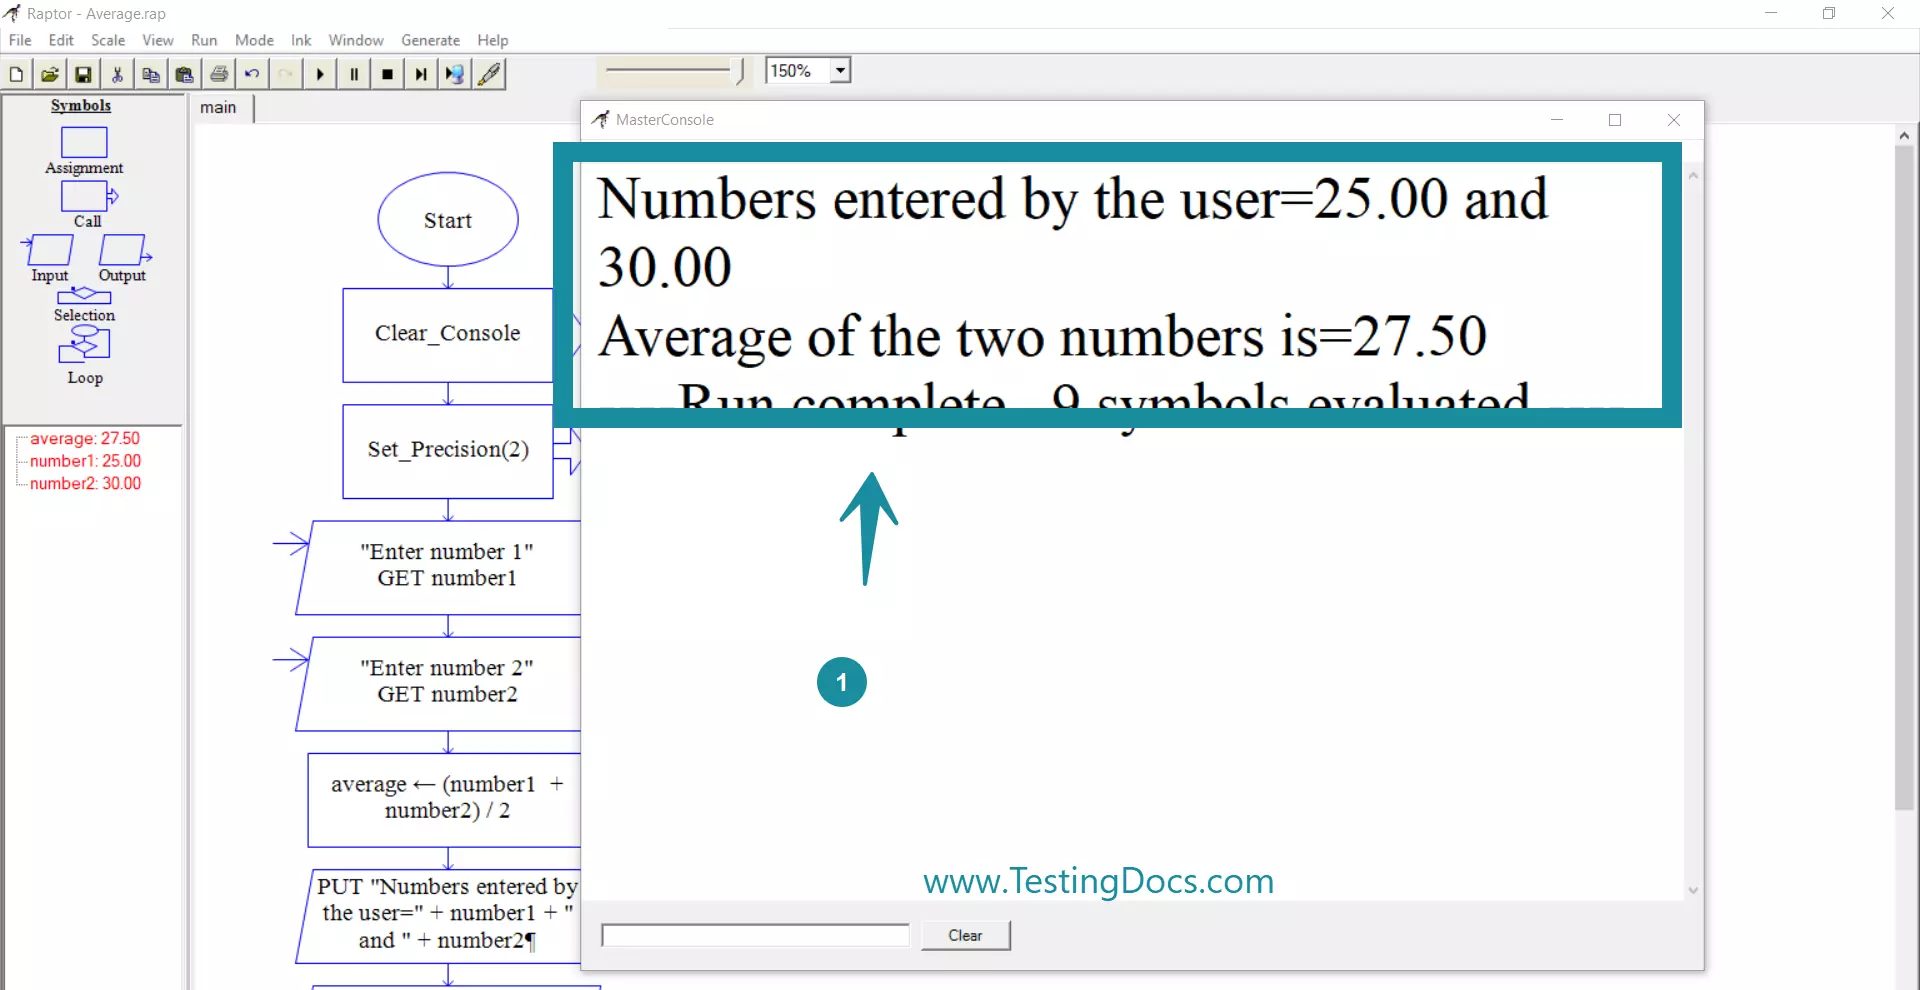
Run the flowchart.
Enter values 25 and 30 for the input numbers.
Numbers entered by the user=25.00 and 30.00
Average of the two numbers is=27.50

More Flowchart Examples
https://www.testingdocs.com/raptor-flowchart-examples/