Overview
In this post, we would be using the JFreeChart library to write a sample Java program to generate PieChart for test automation results. We will also discuss JFreeChart API and a sample program to generate PieChart for our Test Automation Result.
Sample data:
Sample data for our test automation result would be:
Passed test cases : 50
Skipped test cases : 20
Failed test cases: 30
——
Total Automation Test cases : 100
JFreeChart API
JFreeChart is a free Java chart library that makes it easy for developers to display charts in their applications. Its features include support for different chart types, a well-documented API. More information can be found on the official website at:
http://www.jfree.org/jfreechart/
JFreeChart supports bar charts, line charts, pie charts. It allows you to draw a chart on a graphics device. It plots different charts using ChartFactory. ChartFactory is an abstract class with a collection of methods for creating standard charts with JFreeChart.
You should use a ChartPanel to display a chart in a GUI. It is a Swing GUI component for displaying a chart object. The panel registers with the chart to receive notification of changes to any component of the chart.
ChartPanel implements many listener interfaces like ChartChangeListener, ChartProgressListener, ActionListener, MouseListener etc.
PiePlot class is a plot that displays data in the form of a pie chart, using data from any class that implements the PieDataset interface.
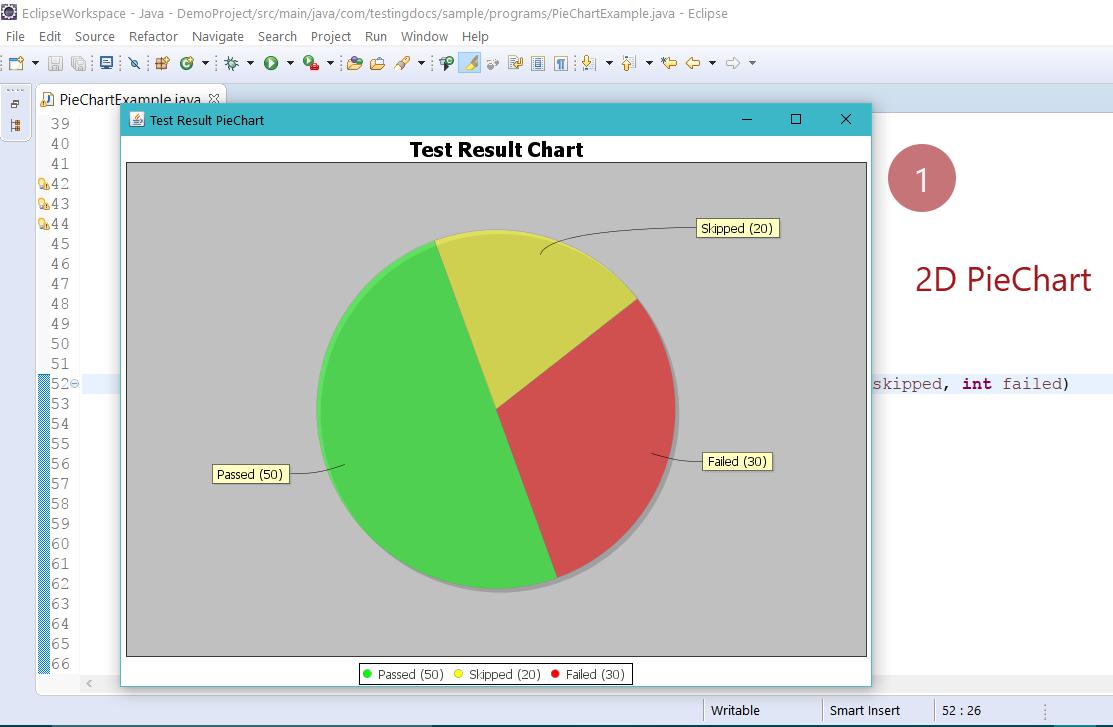
Sample Java Program
We will write a program to plot the chart for the automation test result.
public class PieChartExample extends ApplicationFrame
{
 private static final long serialVersionUID = 1L;

public PieChartExample(String title) {
 super(title);
 // TODO Auto-generated constructor stub
 }

public JFreeChart createPieChart(String title, PieDataset dataset)
 {
 JFreeChart chart = ChartFactory.createPieChart(

title,
 dataset,
 true,
 true,
 false);

PiePlot plot = (PiePlot)chart.getPlot();
 plot.setStartAngle(290.0D);
 plot.setDirection(Rotation.CLOCKWISE);
 plot.setForegroundAlpha(0.5F);

 ChartPanel chartPanel = new ChartPanel(chart);
 chartPanel.setPreferredSize(new Dimension(750, 550));
 setContentPane(chartPanel);
 return chart;
 }

private static PieDataset createPieChartDataset(int total, int passed, int skipped, int failed)
 {
 DefaultPieDataset result = new DefaultPieDataset();
 if (total > 0)
 {
 if (passed > 0) {
 result.setValue(" Passed (" + passed + ") ", passed);
 }
 if (skipped > 0) {
 result.setValue(" Skipped (" + skipped + ") ", skipped);
 }
 if (failed > 0) {
 result.setValue(" Failed (" + failed + ") ", failed);
 }
 }
 return result;
 }

public static void main(String args[])
 {
 PieChartExample chart = new PieChartExample("Test Result PieChart");
 chart.createPieChart("Test Result Chart",createPieChartDataset(100, 50,20,30));
 chart.pack();
 RefineryUtilities.centerFrameOnScreen(chart);
 chart.setVisible(true);

}
}
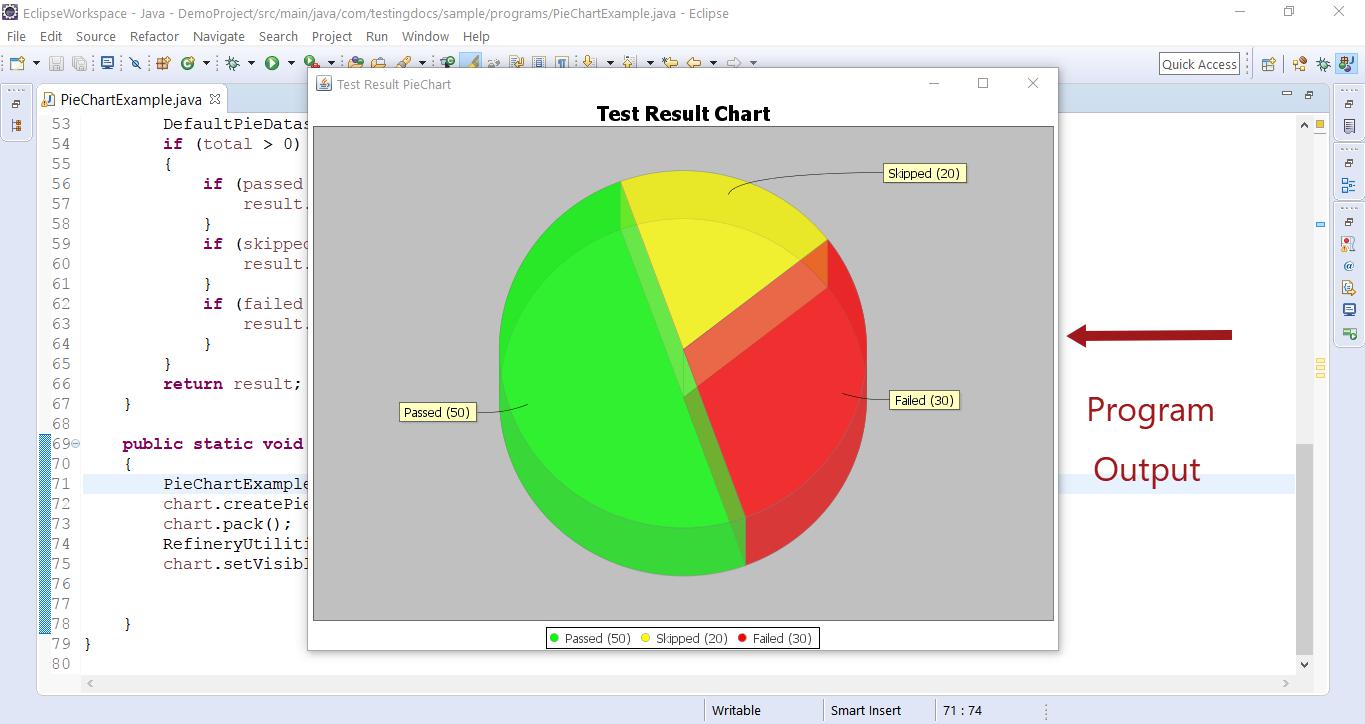
Program Output

3D Pie Chart:
In-case, you need 3D chart, you can use PiePlot3D class and ChartFactory.createPieChart3D method to generate pie chart in 3D as shown below: