

Overview
In this tutorial, let’s understand the Selenium IDE Window Interface and the Selenium IDE Components. We need to get familiar with the tool UI so that we can develop effective automation tests.
Selenium IDE Components
Welcome Screen
https://www.testingdocs.com/selenium-ide-welcome-screen/
IDE GUI Components
The tool components are listed below:
- Menu
- Tool bar
- Address Bar
- Test Navigation Pane
- Test Script Editor
- Log & Reference Pane
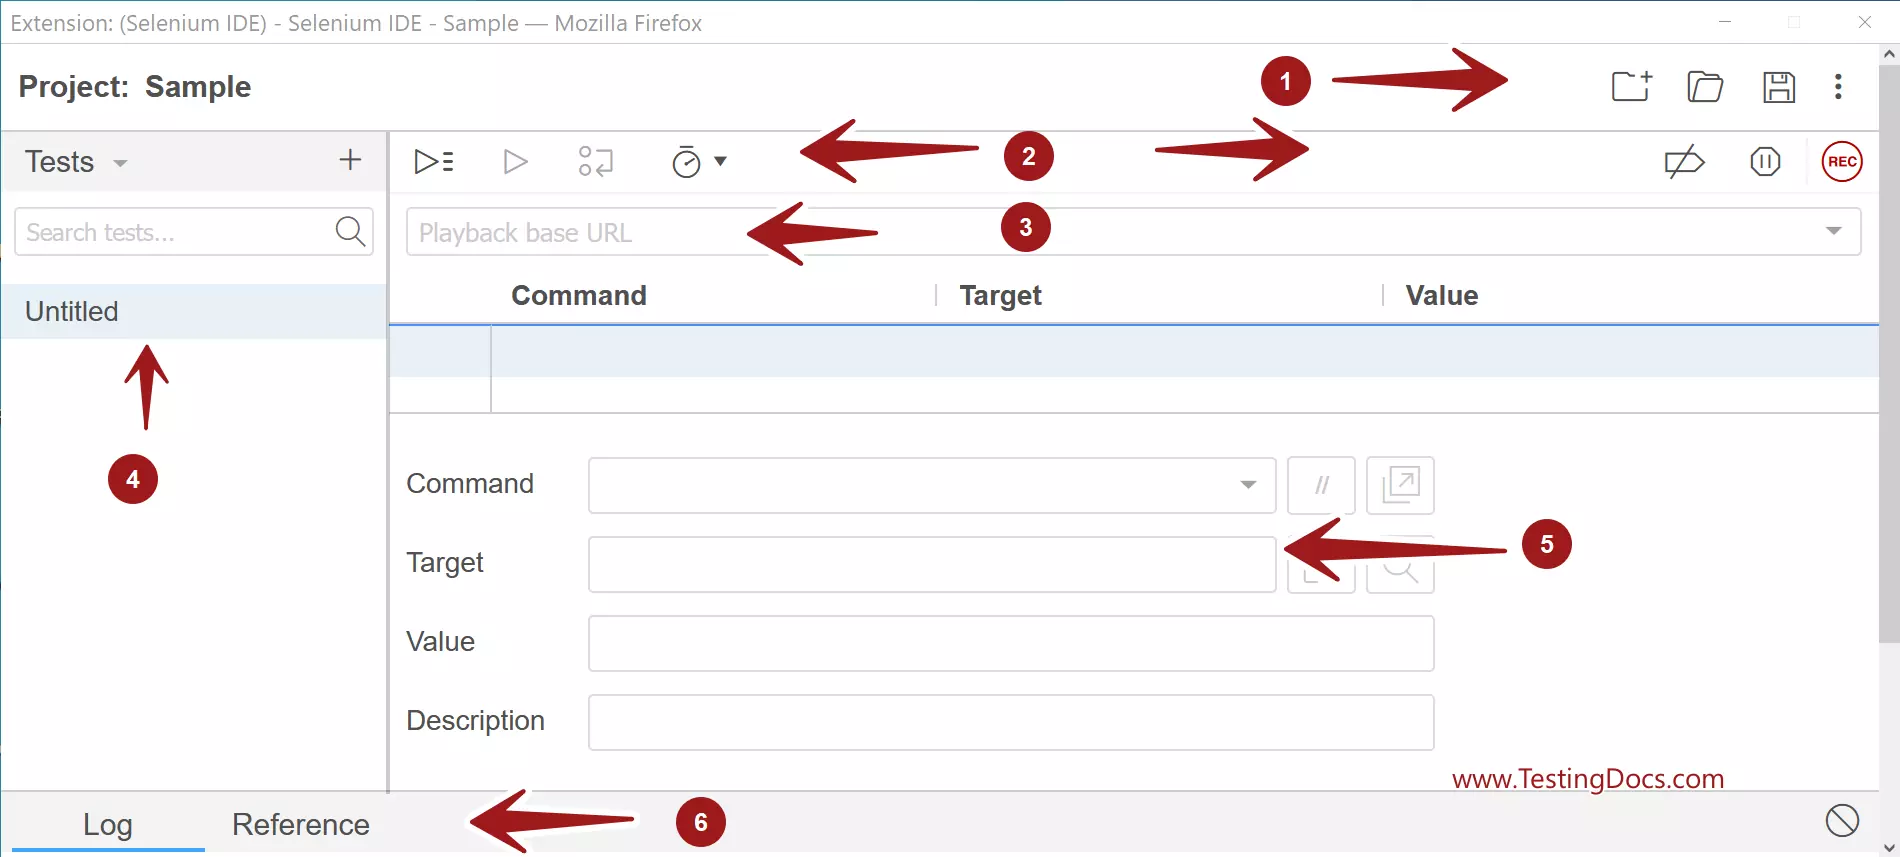

Menu
The menu includes icons for the frequently used actions, such as Create new project, Open project, Save Project and Help menu.
Toolbar
Tool bar contains icons for controlling the execution of the tests. The toolbar button are as follows:
- Run all tests
- Run current test
- Step over current command
- Test speed control
- Disable breakpoints
- Pause on exceptions
- Start Recording button.
Address bar
Address bar contains the playback base URL. This is the application under test base URL. Address bar is a drop down of all the URLs visited by the tool.
Test Navigation Pane
Navigation pane displays the list of all recorded tests. We can create Test suites and organize and group the tests into Test suites.
Test Script Editor
Test Script Editor pane displays the Selenese commands of the recorded test and user interactions during the recording by the IDE. The script editor contains three columns:
- Command
- Target
- Value
Log Pane
Log window pane displays the runtime log messages during the test playback execution. The Reference window displays the details of the selected Selenese command in the Test Script Editor.
—
Selenium IDE Tutorial page:
https://www.testingdocs.com/selenium-ide-tutorials/
For More information on Selenium IDE:
https://www.selenium.dev/selenium-ide/