

Die roll Probability Raptor Flowchart
In this tutorial, we will perform a Simulation of probabilities die roll using Raptor Flowchart.

Total outcomes of a die roll = 6
P(roll) = 1/6
For Example P(4) = 1/6
Raptor Flowchart
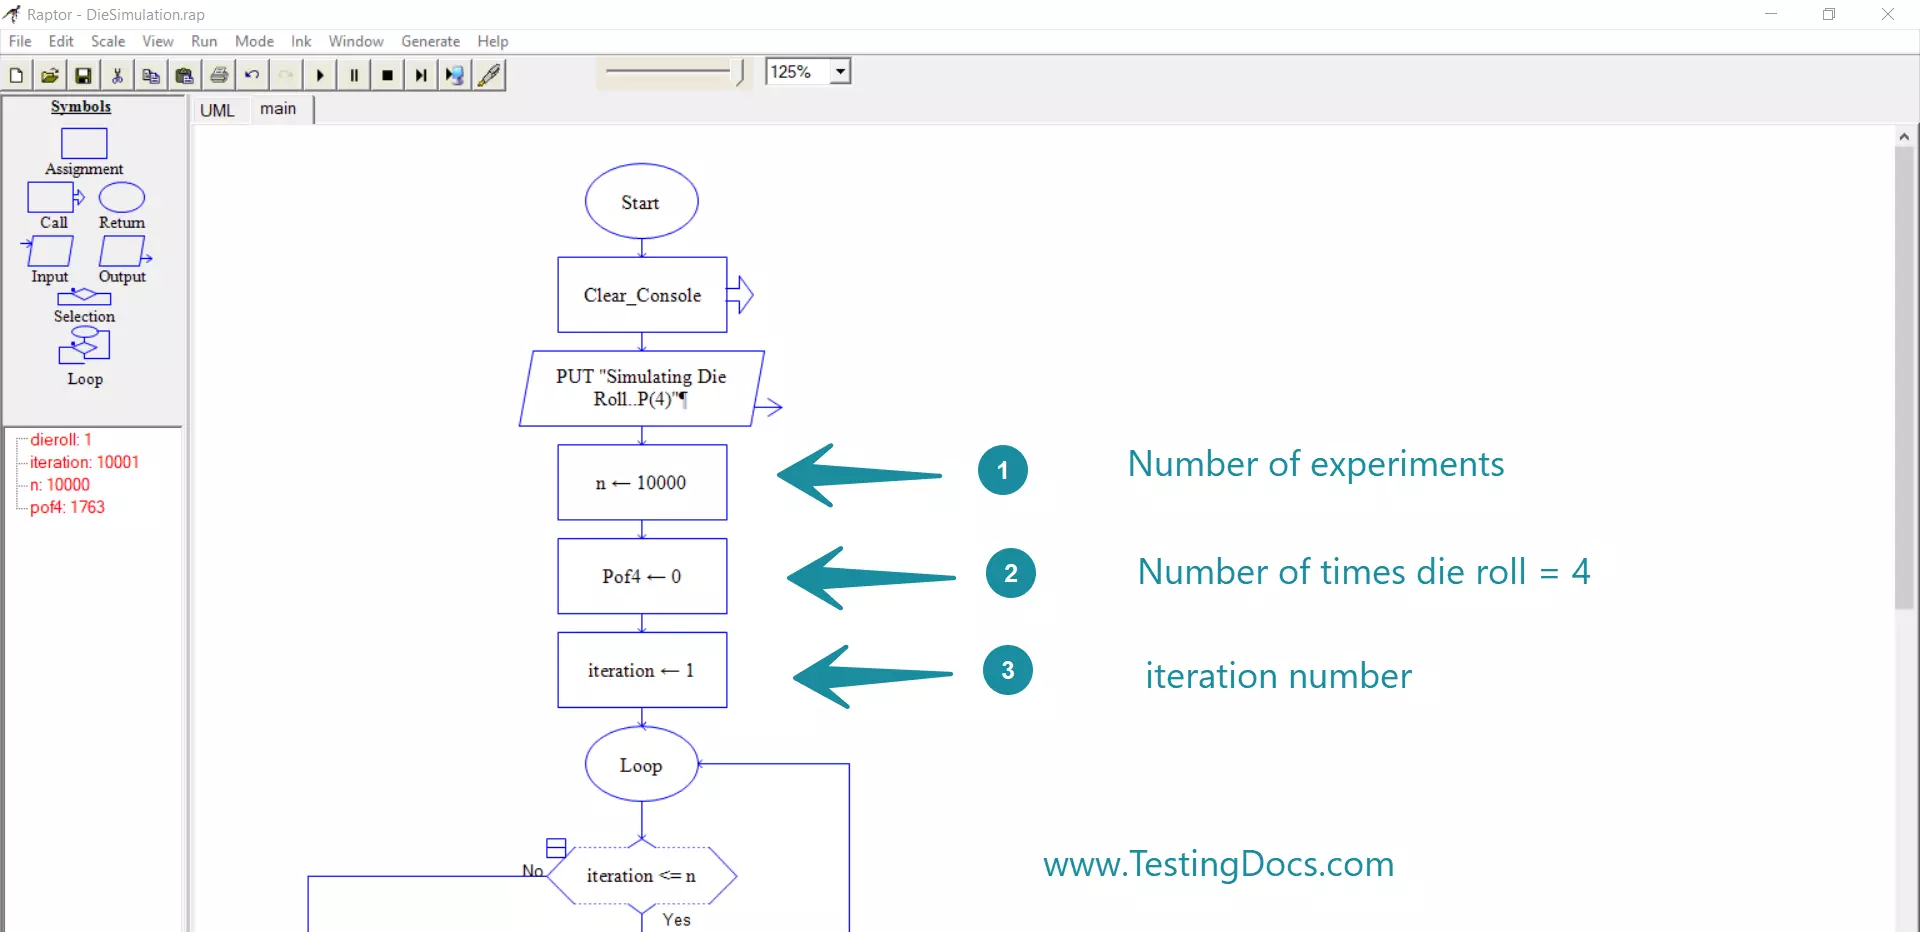
Let’s run an experiment and draw a flowchart simulating the rolling a die for n=10000 times.
P(4)=Number of times the dire rolled 4/Total number of die
= Number of times the dire rolled 4)/n
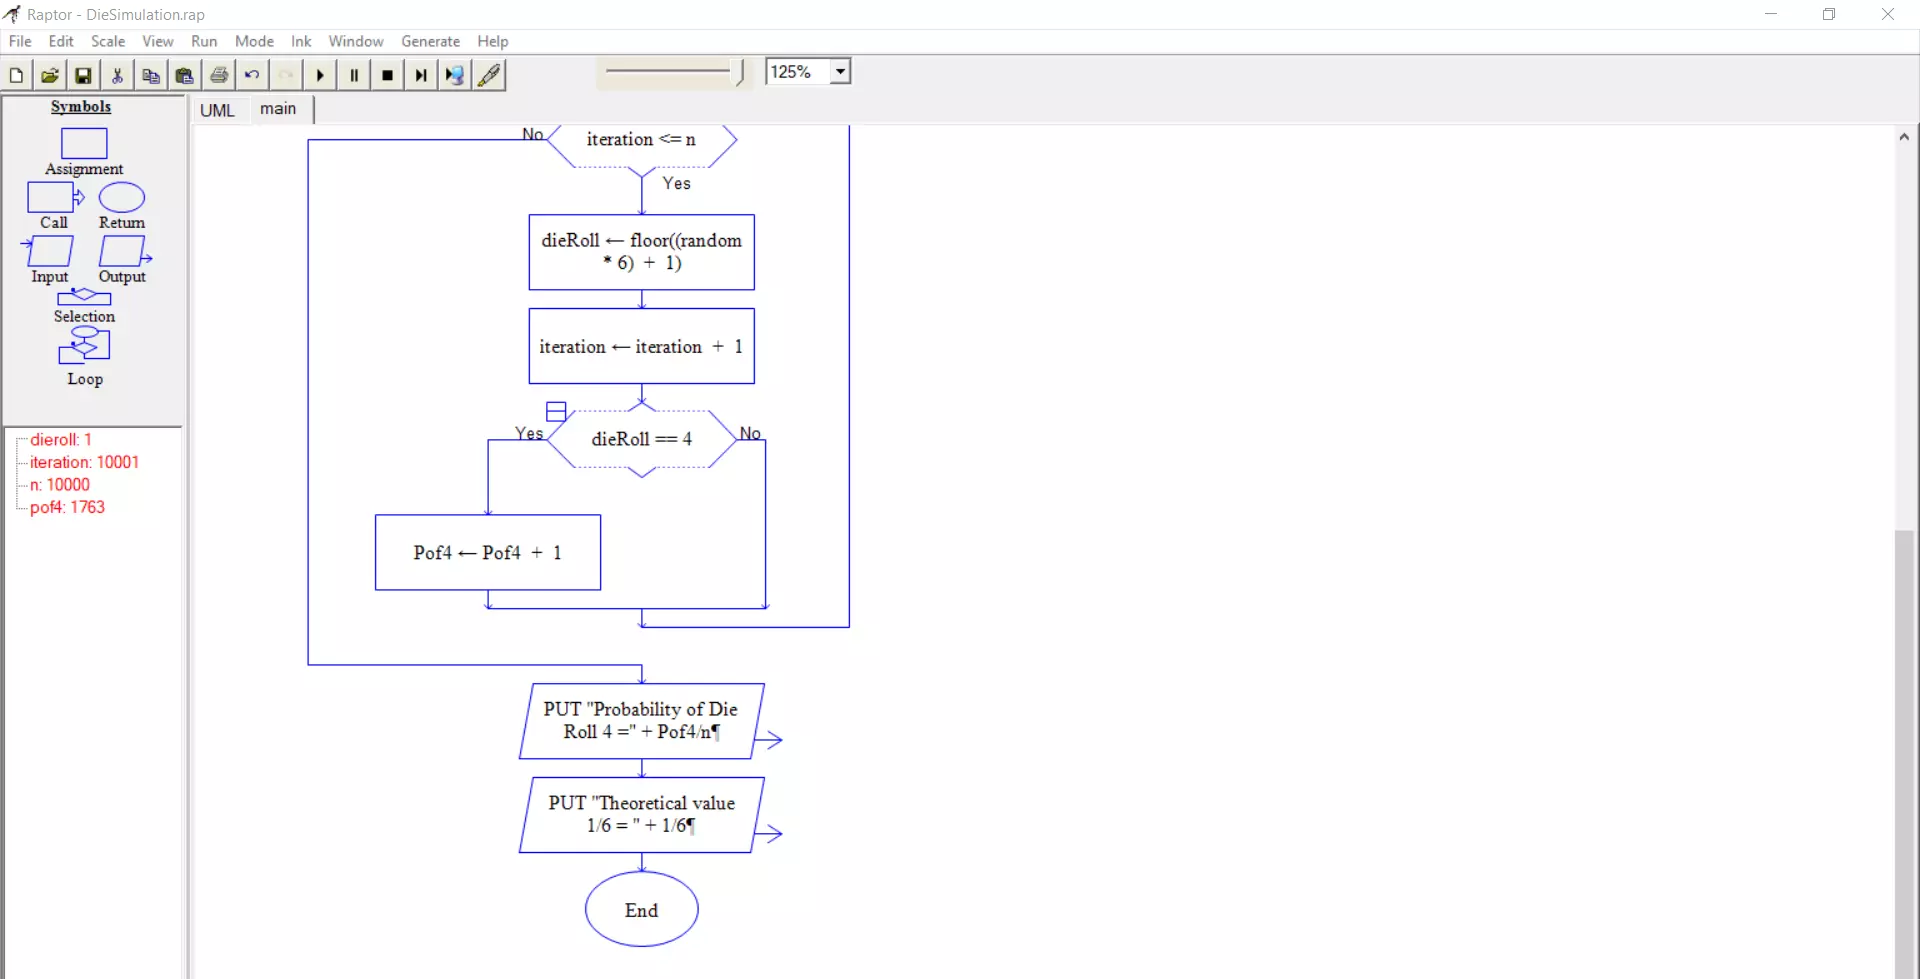
We track each experiment with iteration. We loop each experiment for the n times. The raptor flowchart for the die simulation is shown below:
The number of times the die rolled 4 is tracked with variable P0f4.
P(4) = Pof4/n


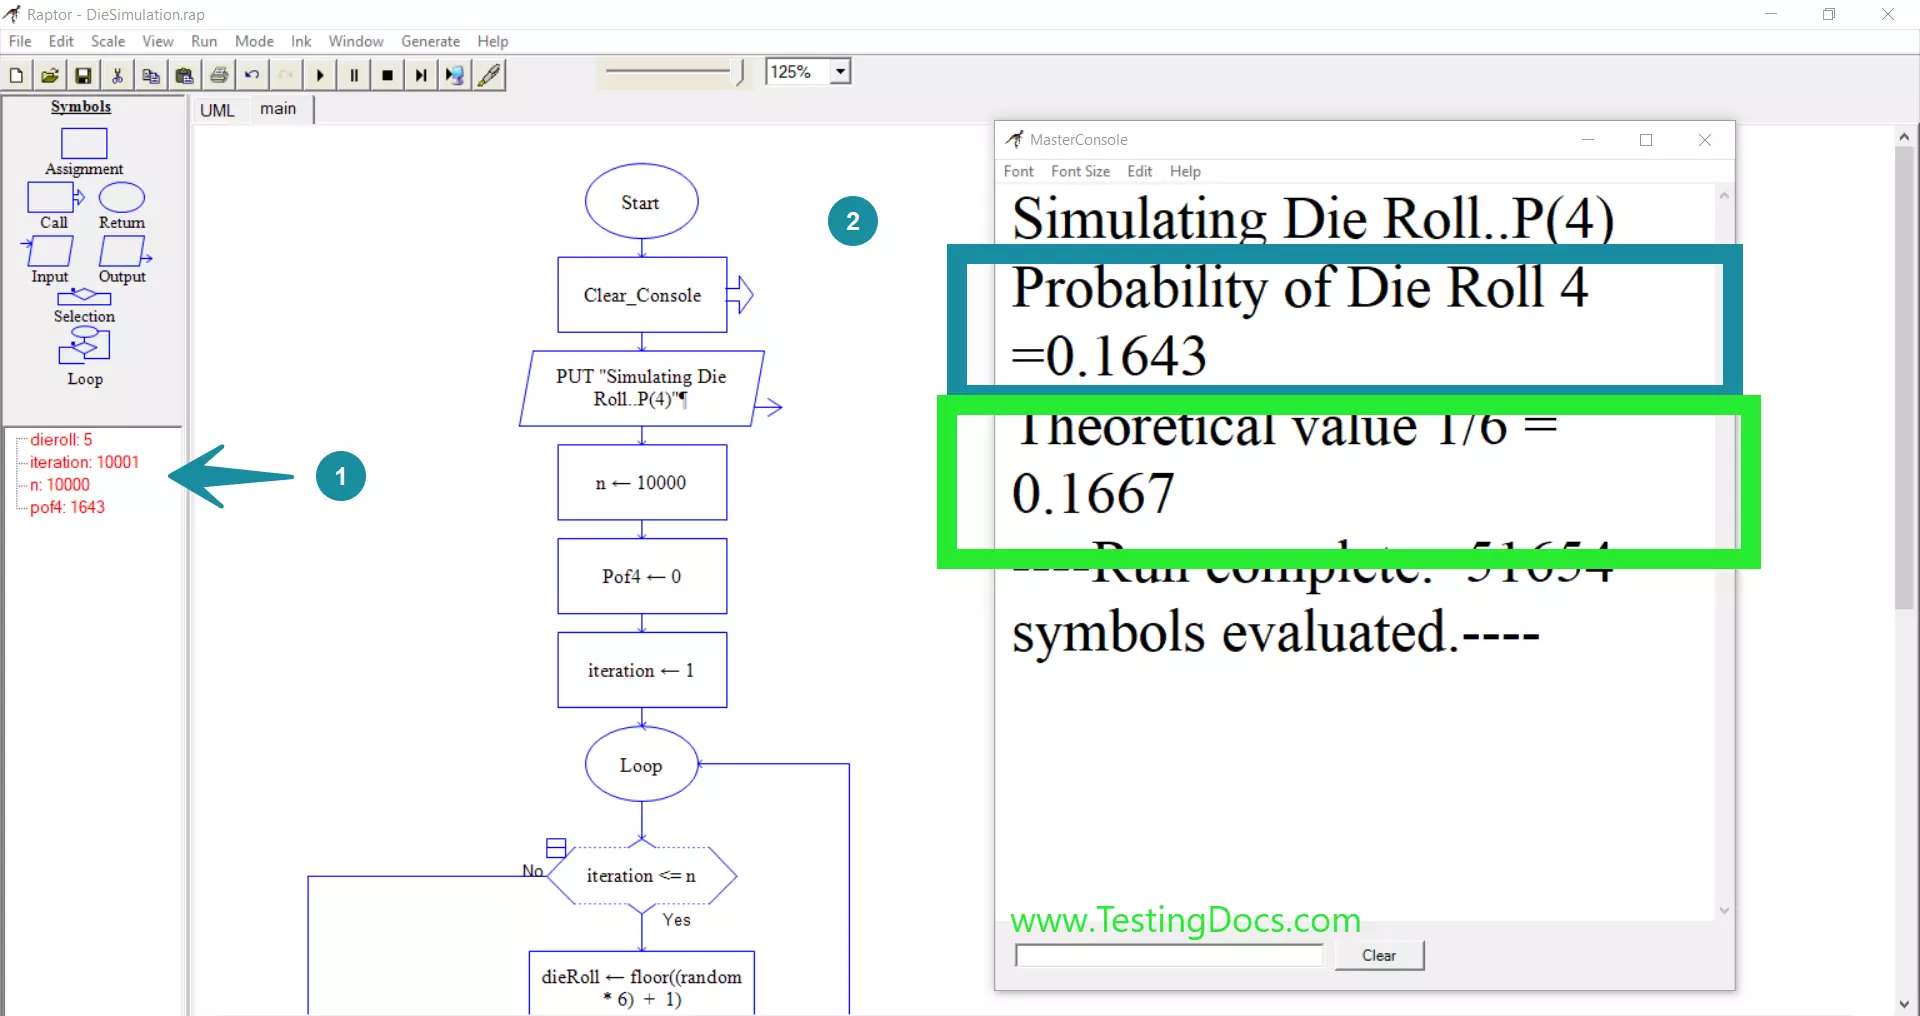
Sample Output
The console output of the flowchart is:
Simulating Die Roll..P(4)
Probability of Die Roll 4 =0.1643
Theoretical value 1/6 = 0.1667

Pseudocode:
/**
* NAME:
* DATE:
* FILE:
* COMMENTS:
*/
START
// declare variables
int iteration = 0;
int Pof4 = 0;
int n = 10000;
int dieRoll = 0;
PRINT(“Simulating Die Roll..P(4)”);
n = 10000;
Pof4 = 0;
iteration = 1;
WHILE (iteration <= n)
{
dieRoll = floor((Math.random() * 6) + 1);
iteration = iteration + 1;
IF (dieRoll == 4)
{
Pof4 = Pof4 + 1;
}
}
PRINT(“Probability of Die Roll 4 =” + Pof4 / n);
PRINT(“Theoretical value 1/6 = ” + 1 / 6);
END
—
Raptor Tutorials
Raptor Tutorials on this website:
For more updates please like our Facebook page: