

Overview
In this step-by-step tutorial, you’ll find instructions and learn how to create swimlane diagrams using Draw.io.(diagrams.net)
Swimlane Diagrams
A swim lane diagram is a process flowchart that outlines a process from start to finish.
It provides richer information on who does what. It can be expanded to show times—when tasks are done and how long they take. Arrows between process steps show how information flows and transfers from one stage to another.
Alternative Names
- Swimlane diagram
- Process flow diagram
- Cross-functional flowcharts
- Rummler-Brache diagrams
- Swimlane process maps
Steps to create
The steps to create a diagram using the tool are as follows:
Launch the draw.io tool. ( Steps to install the tool are outlined here)
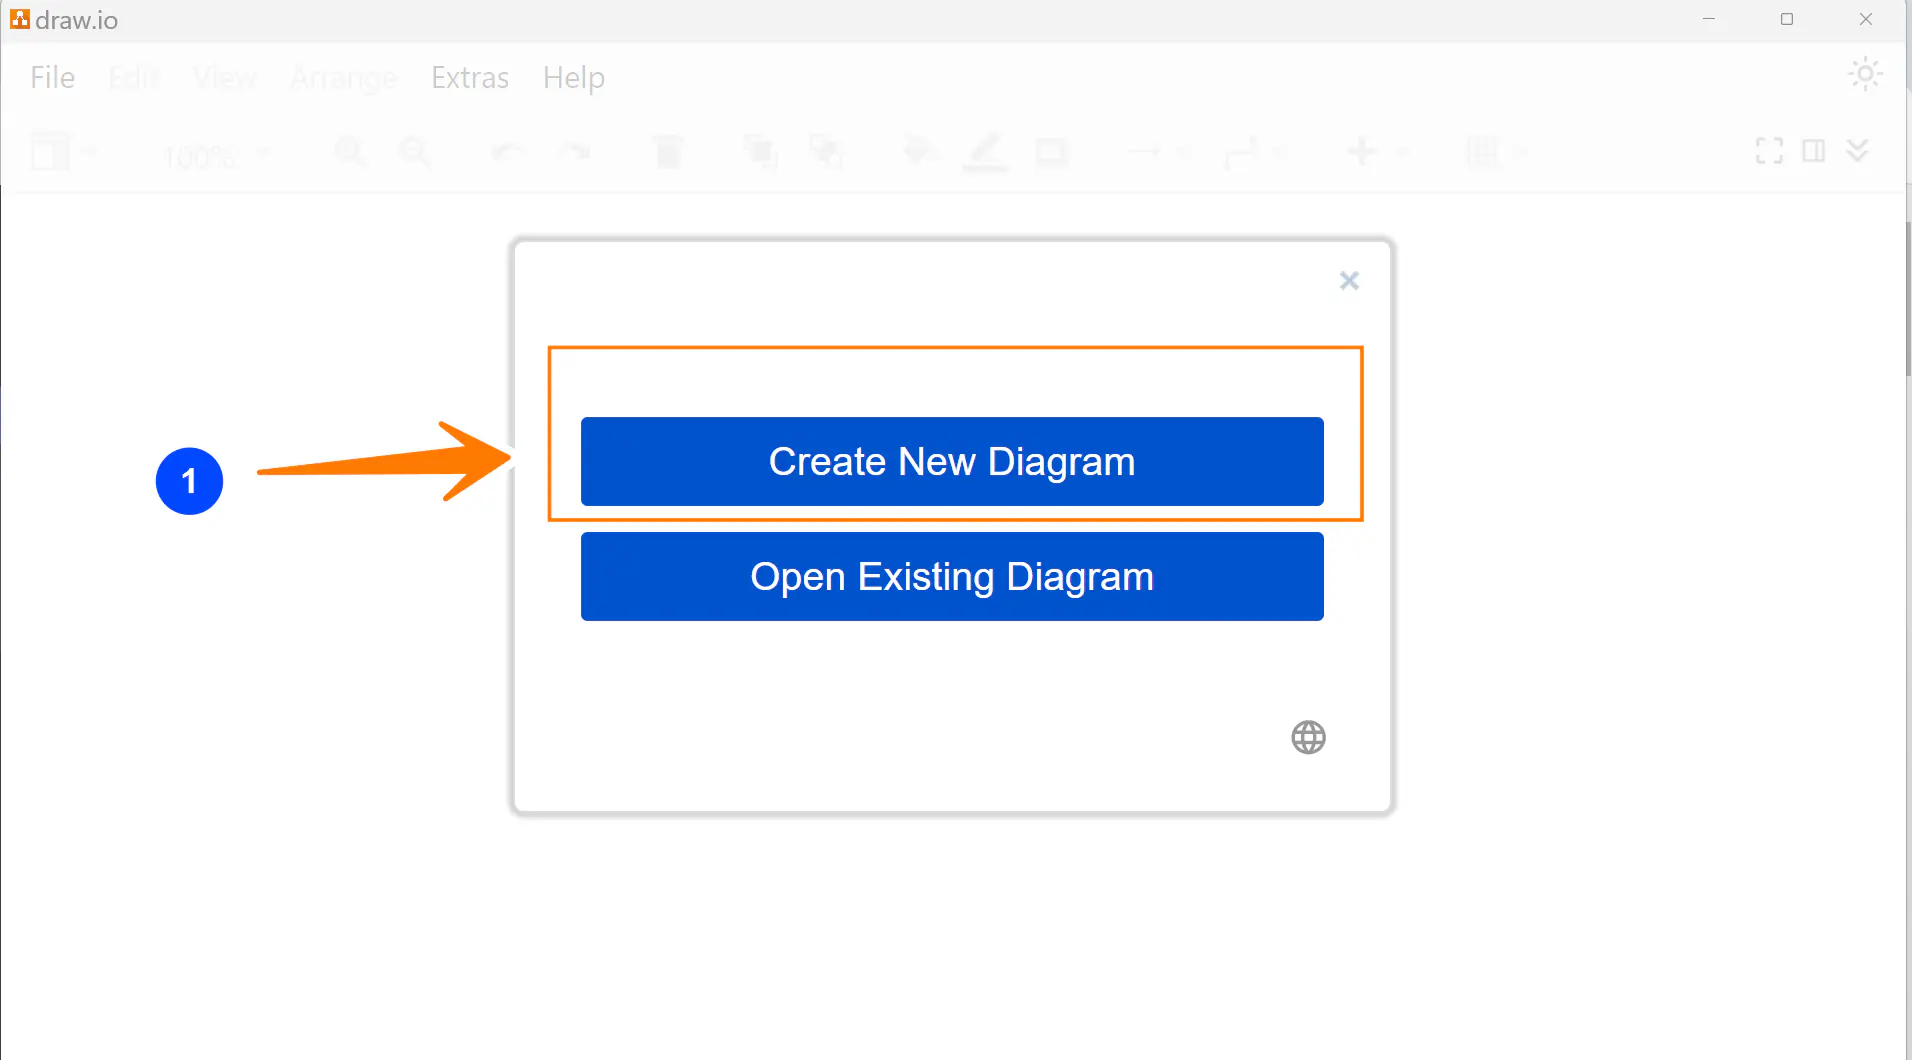
This will launch the diagram screen with options.
Click on the ‘Create New Diagram‘ button.

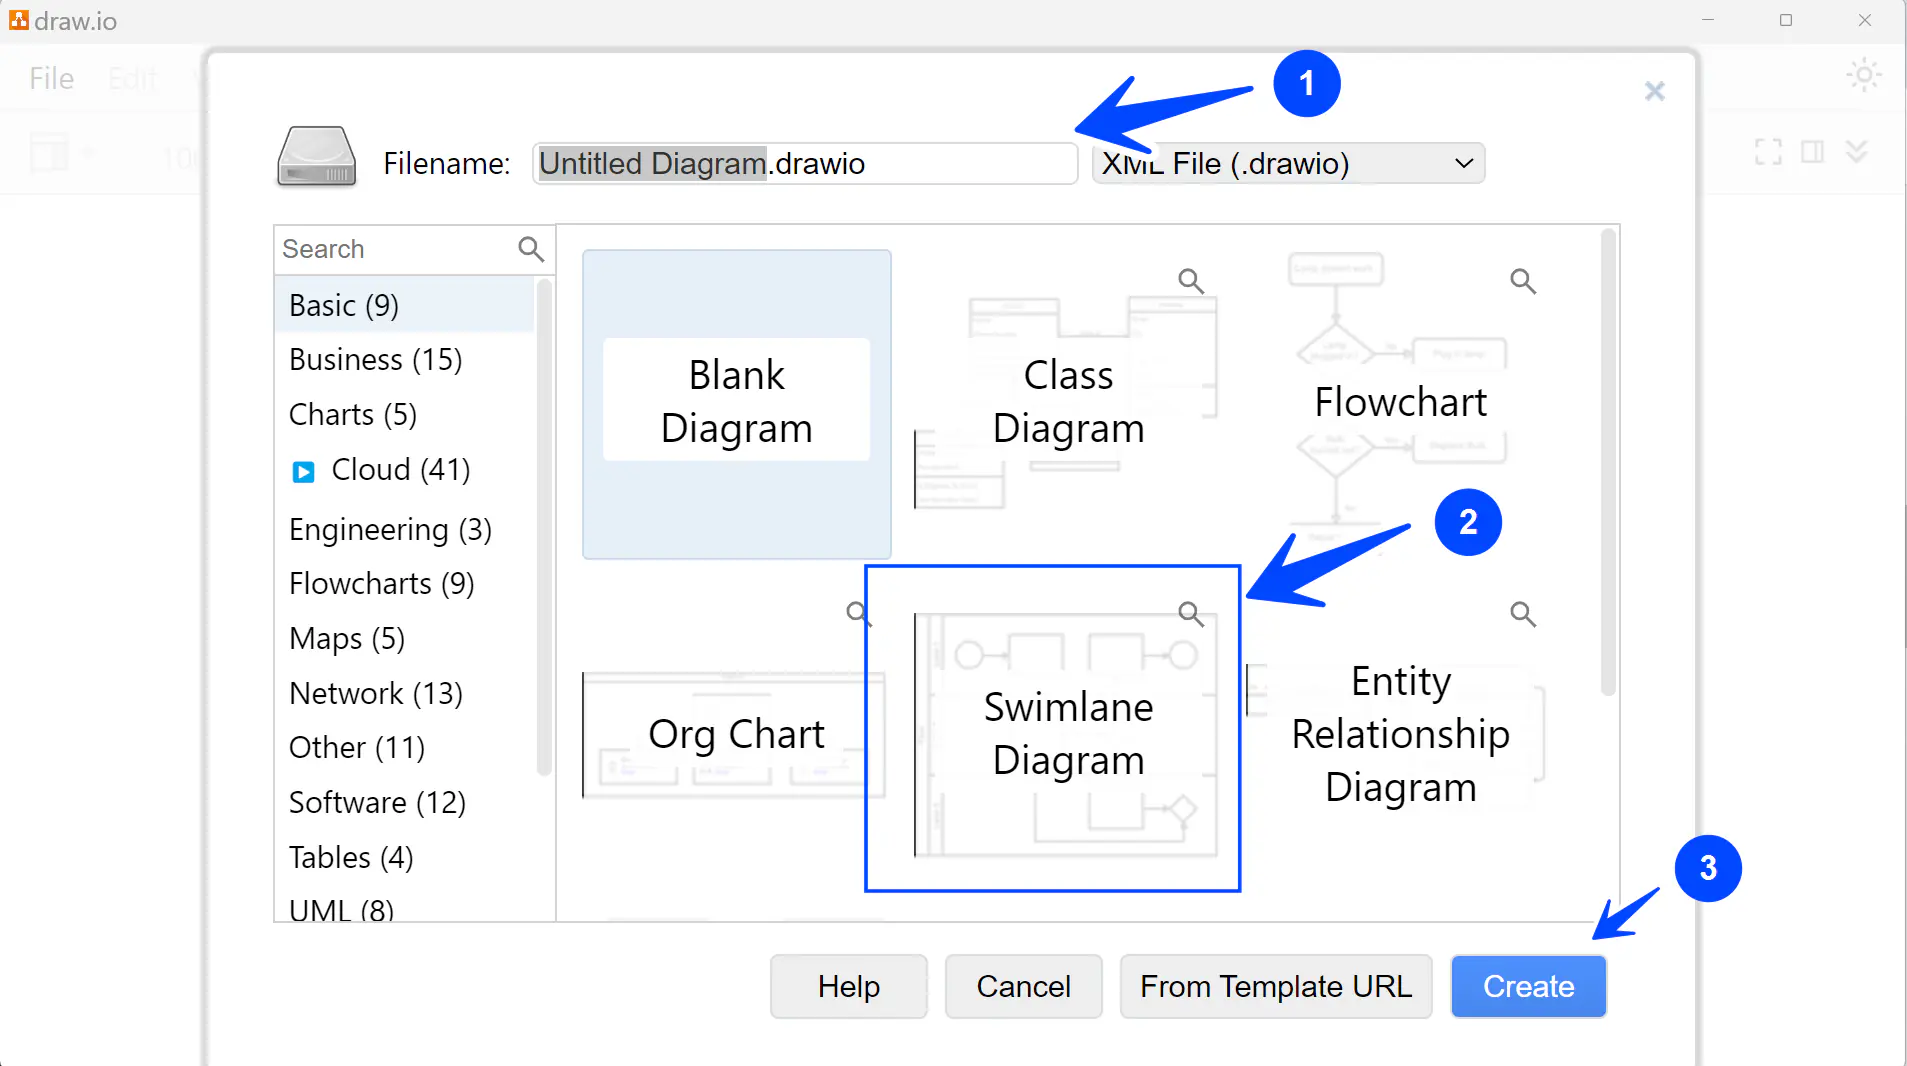
Give a Filename to the diagram.
Choose the option ‘Swinlane Diagram.’
Click on the Create button.

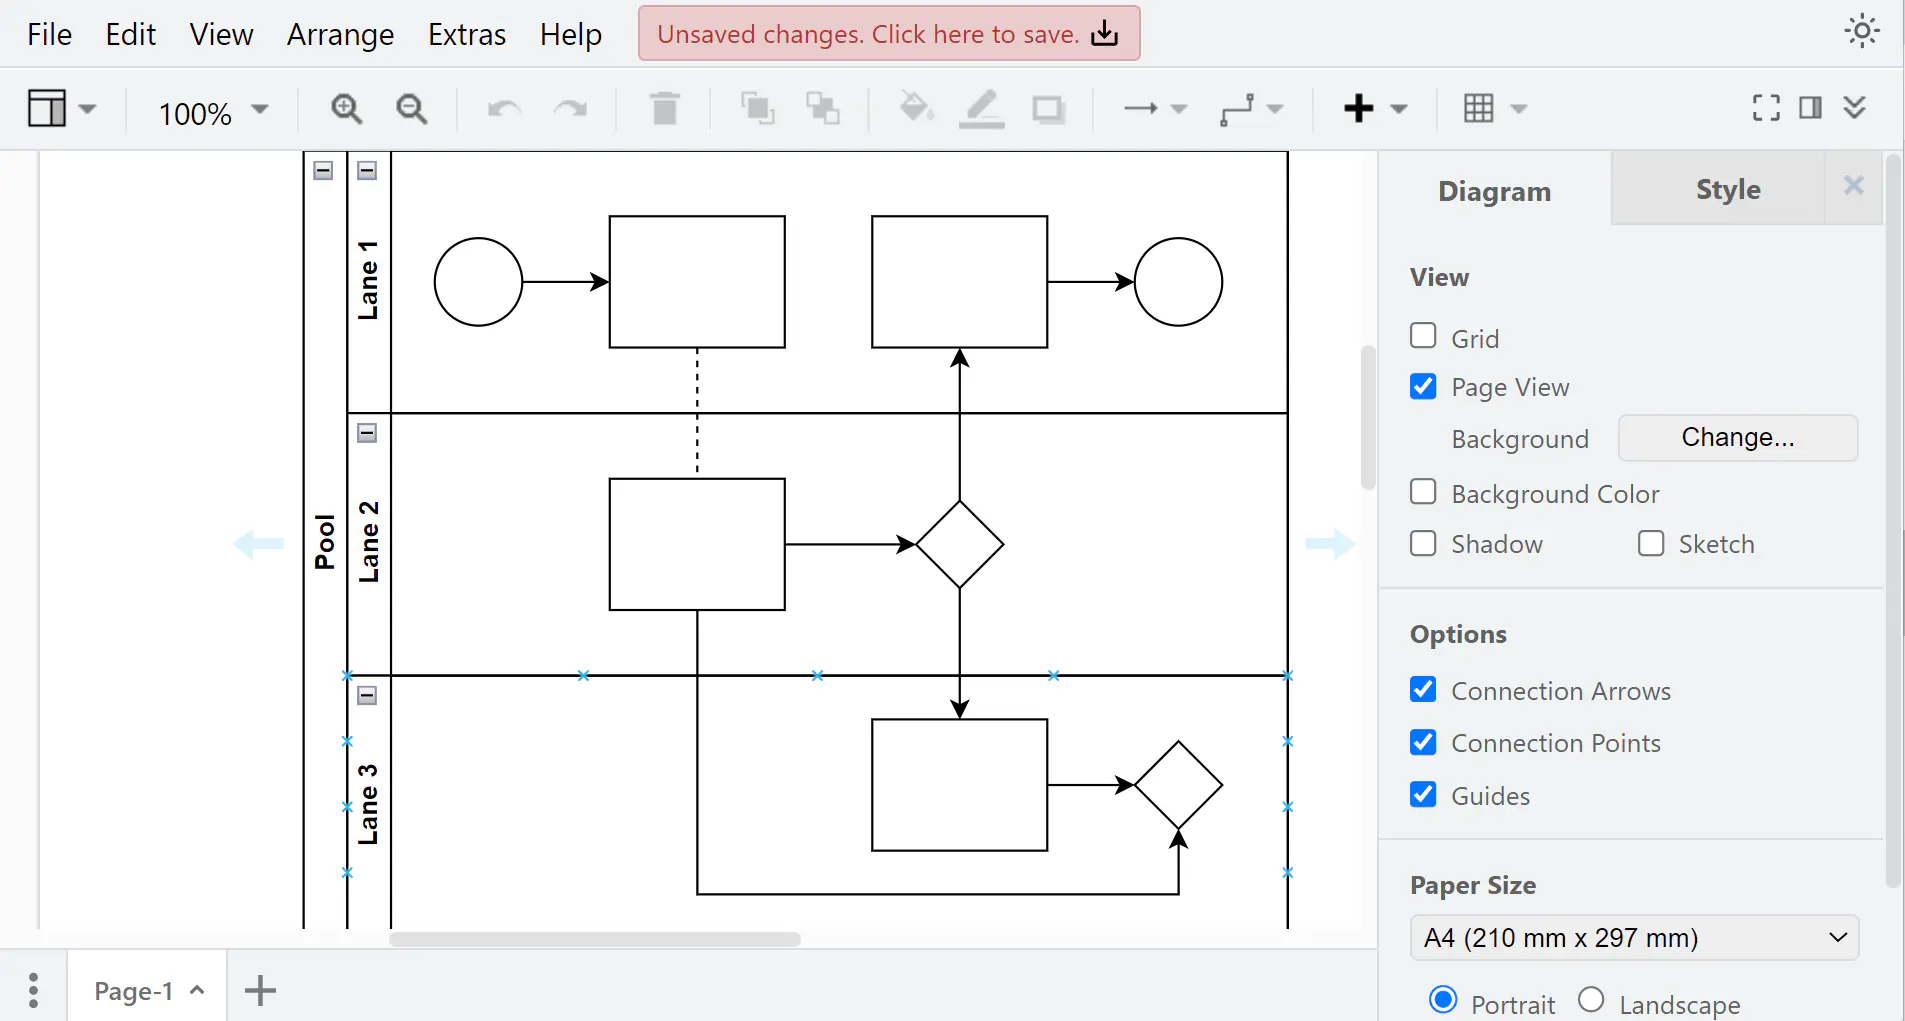
This will open a swimlane template with a three-lane to start working with it.
We can start editing and adding components to the diagram.

The general steps to create a swim lane diagram are as follows:
Identify Participants
Determine the individuals, departments, or entities involved in your diagramming process. These will become the “lanes” in your swim lane diagram. Each lane corresponds to a specific role or department.
Define Activities
Break down the process into specific activities or tasks. These will be placed within the appropriate lanes based on which participant or department is responsible for each activity.
Connect Activities
Use arrows or lines to connect the activities, indicating the flow of the process from one activity to the next. The direction of the arrows typically shows the sequence of steps in the process.
Label the Diagram
Label each activity and decision point clearly to ensure understanding.
Review
Once you’ve created the initial diagram, please review it for accuracy and clarity. Make any necessary revisions or refinements to improve readability and understanding.
Save the diagram
Once you’re satisfied with the diagram, save it and distribute it to relevant stakeholders for feedback.
That’s it.
For more information on draw.io, visit the following website: