

Graphical Charts
TestLink also displays Graphical Charts for Test reports. These reports are visual and are easy to understand.
TestLink Charts
Steps to generate the TestLink charts are as follows:
Choose the Report Format drop-down as HTML.
Select the Test Plan from the drop-down list.
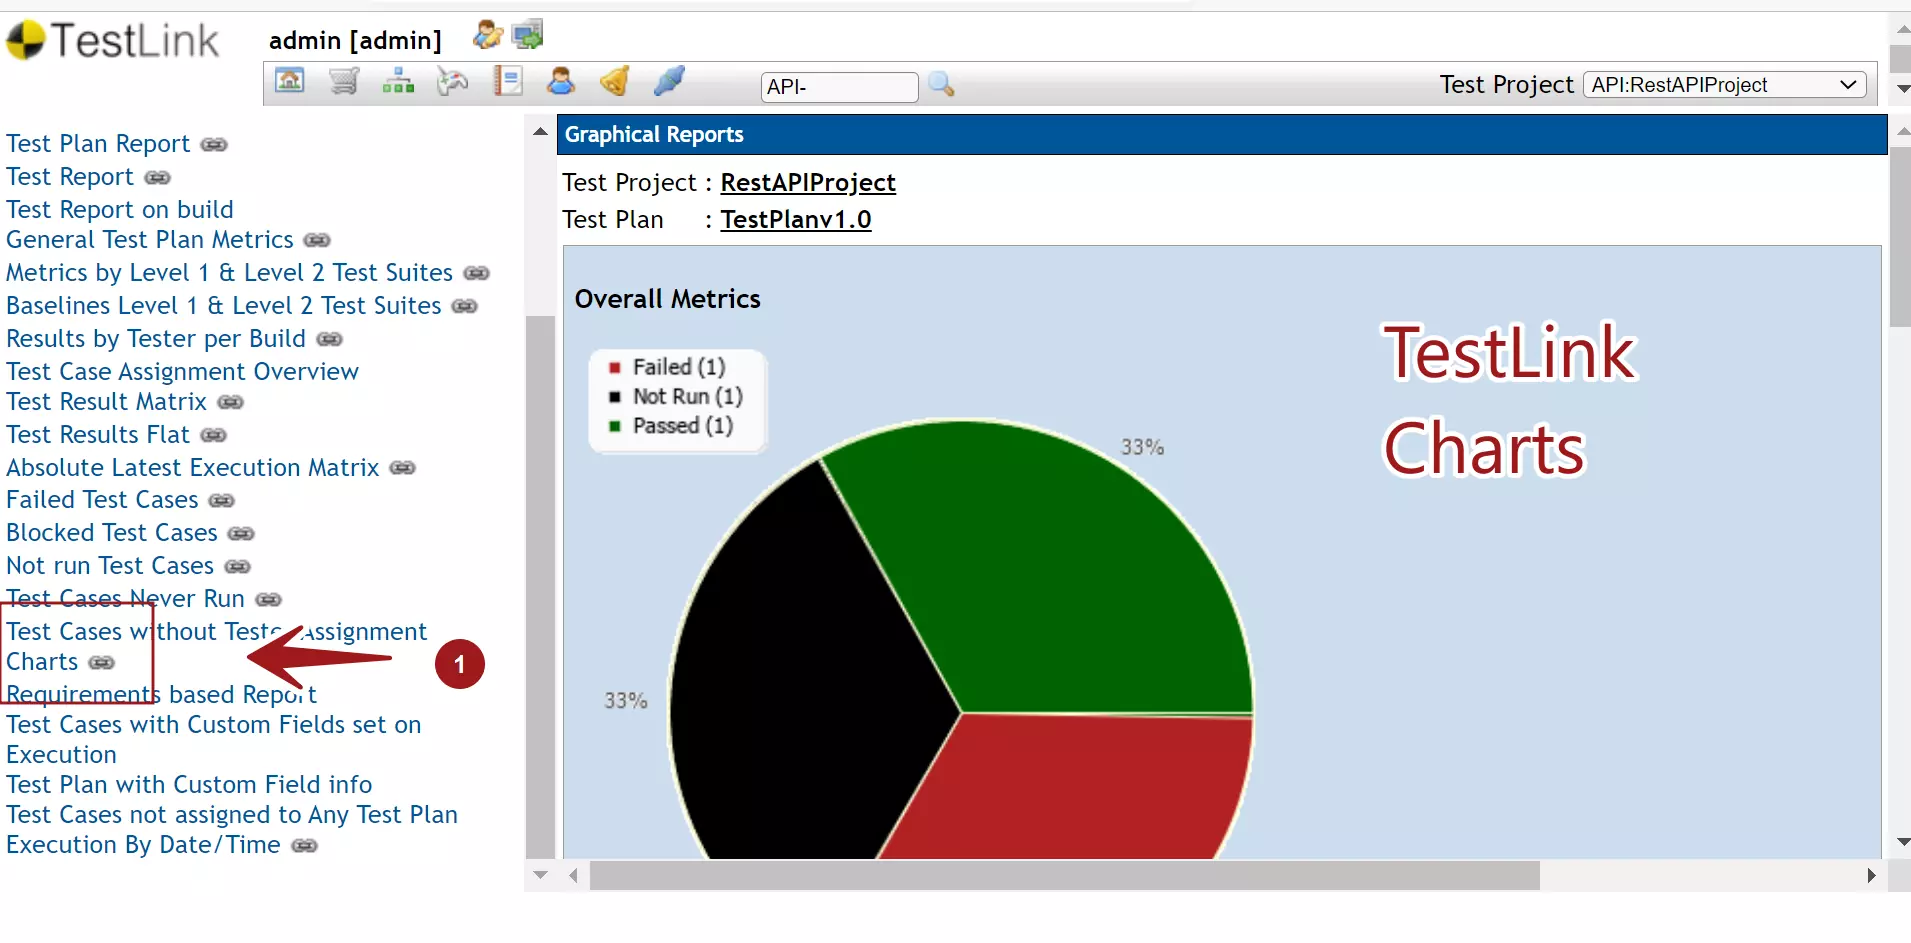
To generate Graphical Reports, Click on the Charts link in the left navigator pane.
View the Graphical Test Reports. The reports would be generated based on the Latest Execution results.
Pie Chart
Overall Metrics are displayed as a Pie chart.
The chart shows the overall Passed, Failed, Blocked, and Not Run Test Cases.

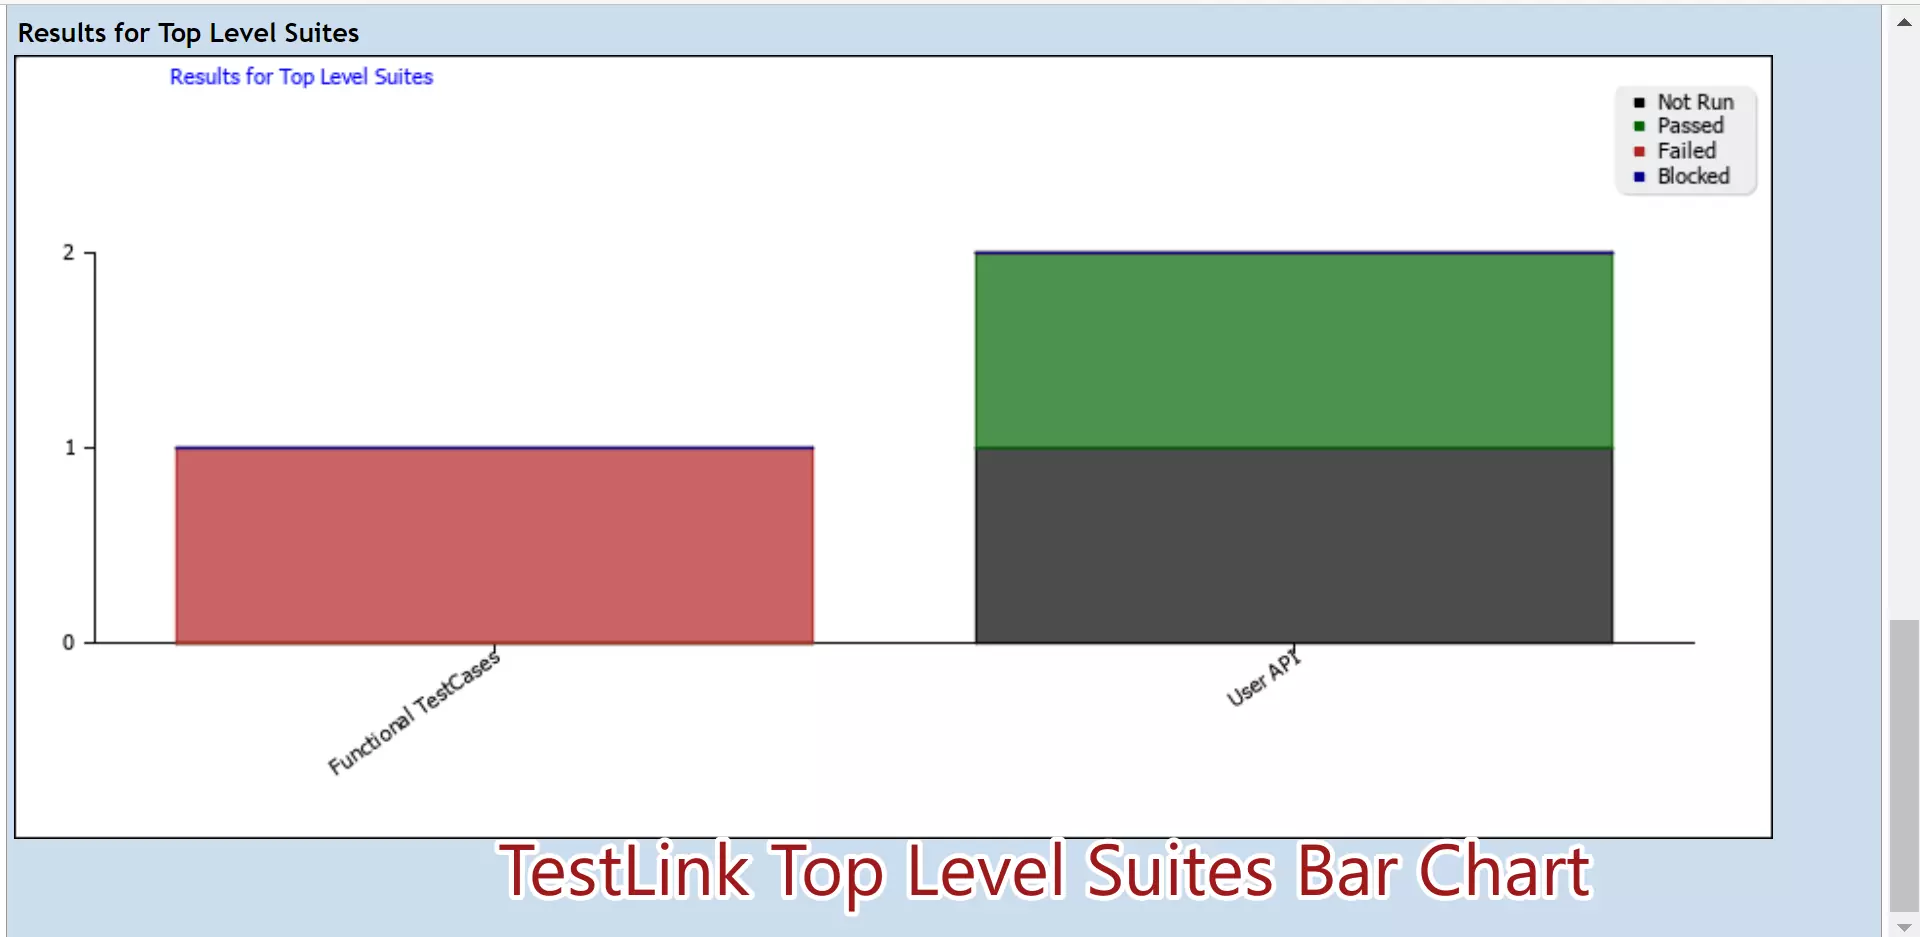
Bar Chart
Results by Keyword and Results for Top Level Suites are displayed
as Bar Charts.

—
TestLink Tutorials
TestLink Tutorial on this website can be found at:
https://www.testingdocs.com/testlink-tutorials/