

Overview
TestLink Metrics Dashboard page shows the project test progress. The dashboard shows the progress for the whole project and active test plans (or all test plans) defined within the project.
Metrics Dashboard
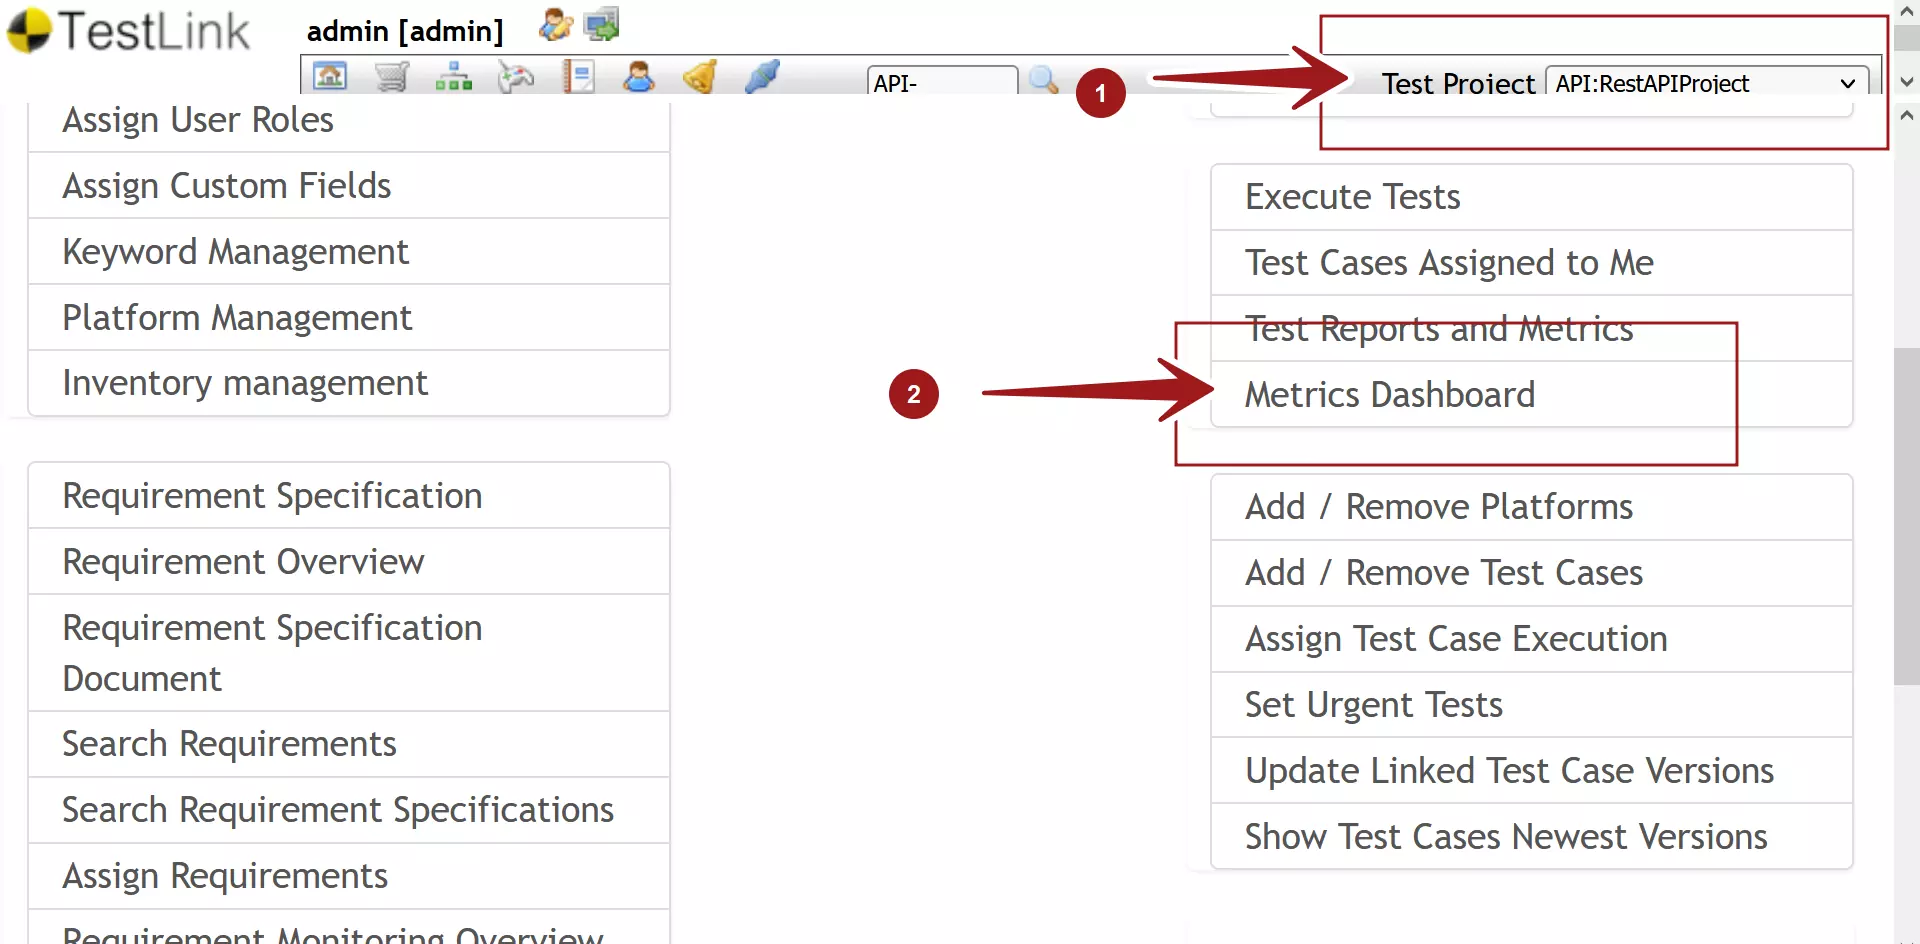
Select the Project from the drop-down list.
Click on the Metrics Dashboard link to view the page.

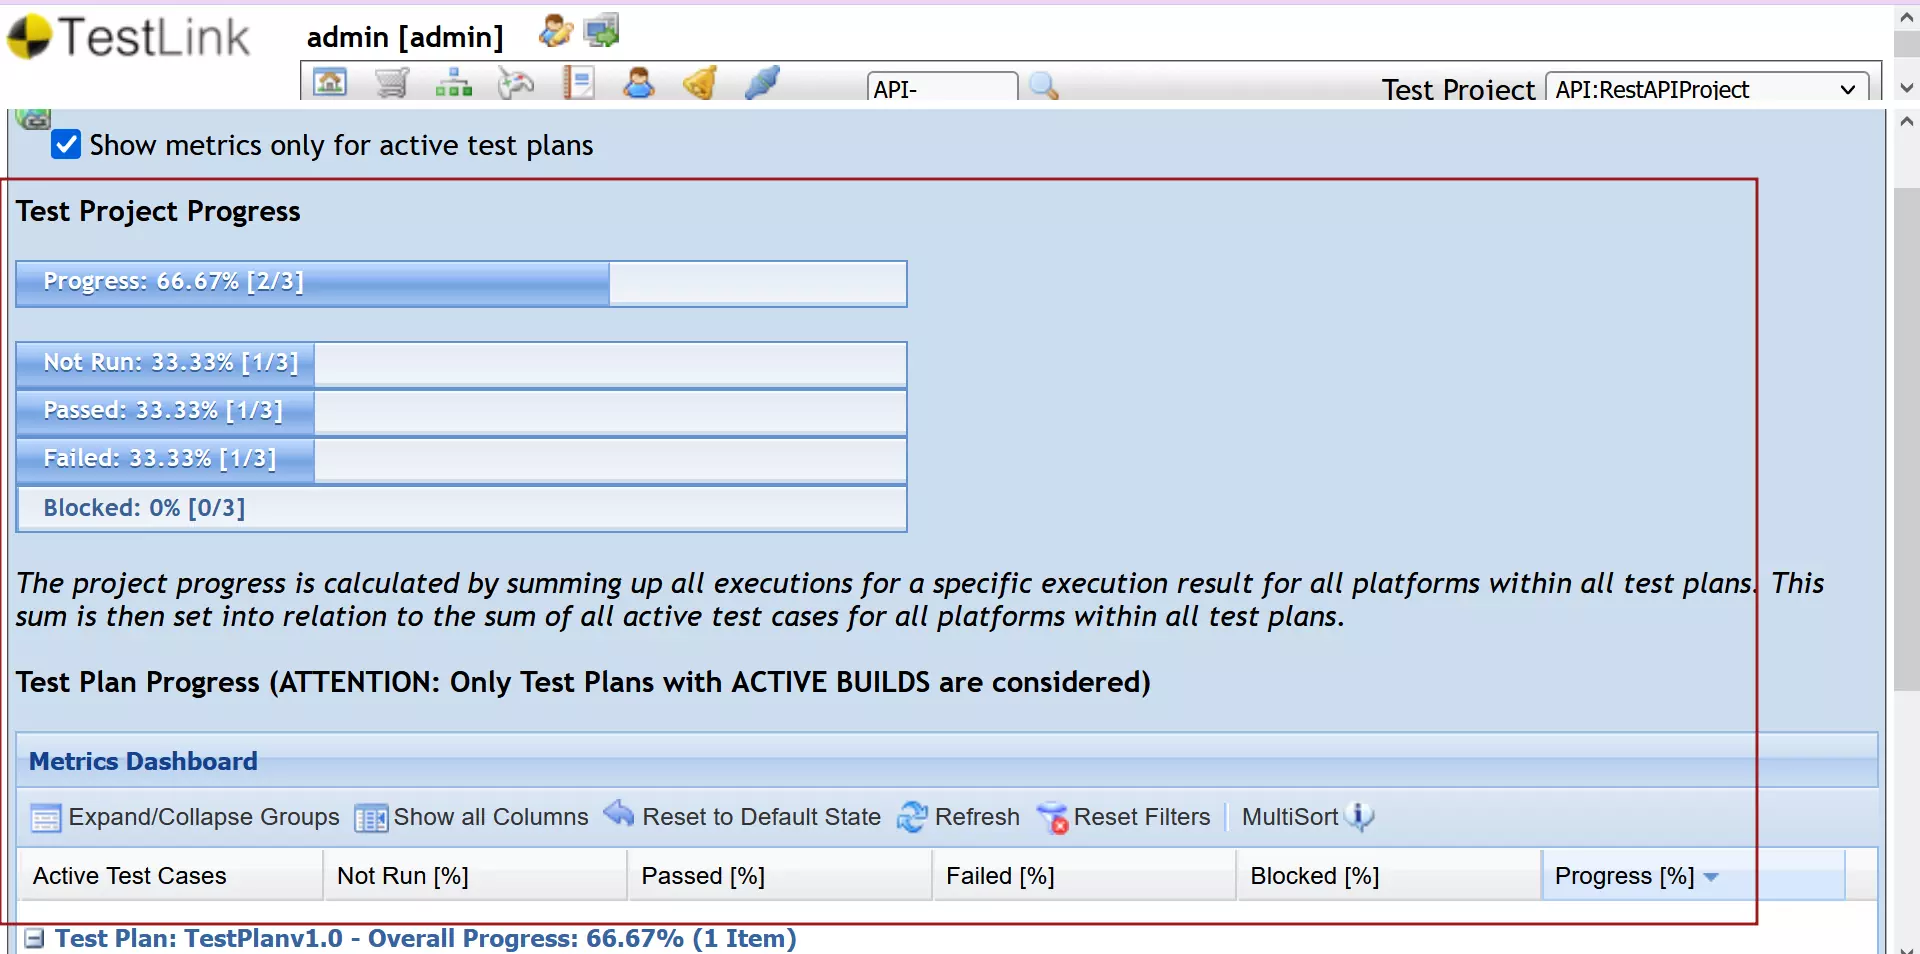
We can check the checkbox Show metrics only for active test plans to display the test metrics only for Active Test plans.
Project Test Progress
Test progress is the percentage of tests that are executed in the project calculated as a percentage. The page displays the overall test progress in percentages. The metrics that are displayed are as follows:
- Not Run %
- Passed %
- Failed %
- Blocked %
- Progress %
Let’s understand the metrics with some examples. We will consider the Passed % metric with one platform and with multiple platforms.
#Example: One Platform

Total Number of Test cases = 3
Passed Test Cases = 1
Passed % = 1/3 * 100
= 33.33 %
This example takes into consideration that there is only one Platform.
#Example: Multiple Platforms
Now consider that there are two platforms for the tests to be executed. (Ubuntu Linux and Windows 10). The tests should be executed on each platform.
Total Number of Test cases = 3
Number of Platforms: 2
Total test cases to be executed = 3 * 2 = 6
Passed Test Cases = 1
Passed % = 1/6 * 100
= 16.66 %
The project progress is calculated by summing up all executions for a specific execution result for all platforms within all test plans.

—
TestLink Tutorials
TestLink Tutorial on this website can be found at:
https://www.testingdocs.com/testlink-tutorials/
For more updates please like our Facebook page:
https://www.facebook.com/TestingDocs/