

Overview
In this tutorial, we will learn how to produce a three-dimensional plot using Octave. Octave has the capability to plot data in both 2D and 3D.
Octave 2D Plots:
https://www.testingdocs.com/two-dimensional-plot-using-octave/
Three-dimensional plot
The 3D plot has three axes i.e x-axis, the y-axis, and the z-axis. The basic 3D plot function in Octave is the plot3 command.
Syntax
plot(x,y,z);
x,y and z are vectors that represent the (x,y,z) coordinates in the three dimensions.
There are several 3D plot functions available in Octave. Some of the functions are as follows:
- ezplot3
- bar3
- pie3
- surf
plot3 is a three-dimensional line plot. To plot surfaces, we can use the surface plot surf command.
Example
Let’s plot a 3D line plot using the plot3 command.
Octave Script
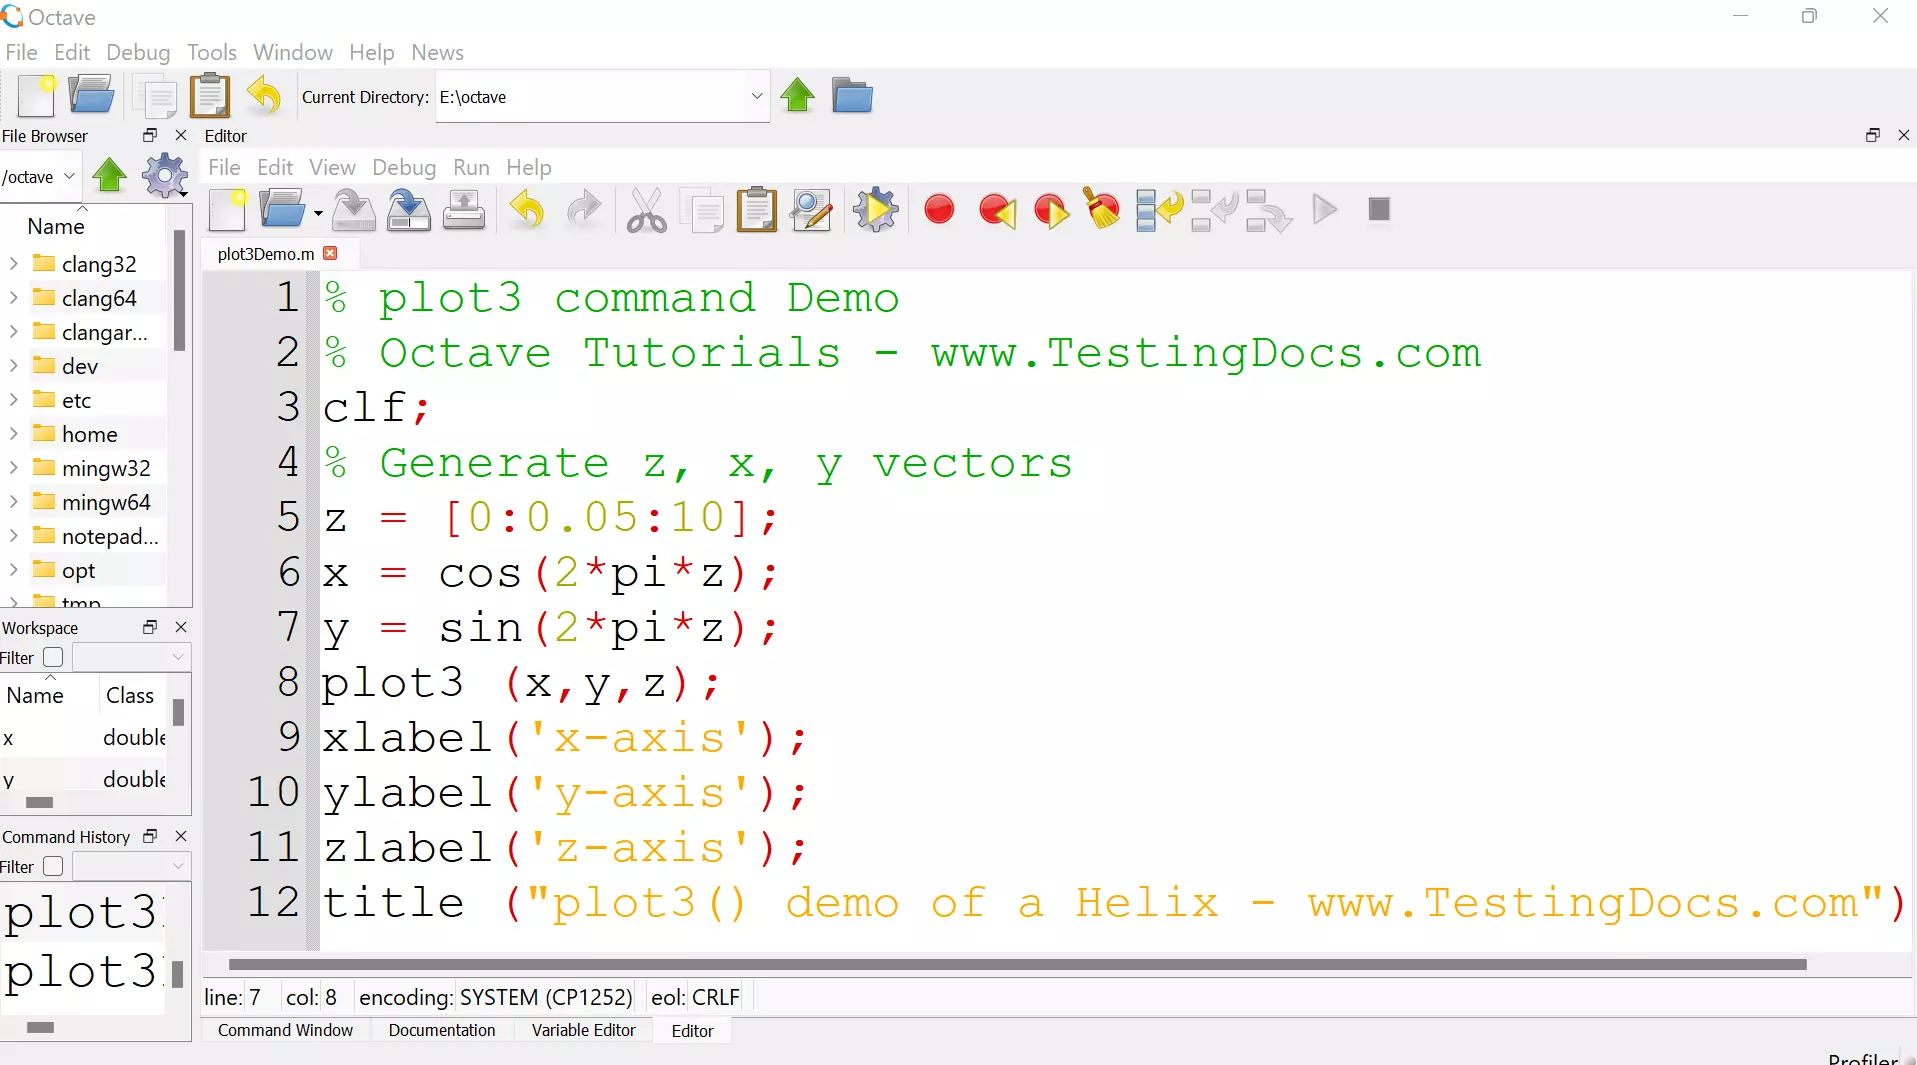
% plot3 command Demo
% Octave Tutorials – www.TestingDocs.com
clf;
% Generate z, x, y vectors
z = [0:0.05:10];
x = cos (2*pi*z);
y = sin (2*pi*z);
plot3 (x,y,z);
xlabel(‘x-axis’);
ylabel(‘y-axis’);
zlabel(‘z-axis’);
title (“plot3() demo of a Helix – www.TestingDocs.com”);

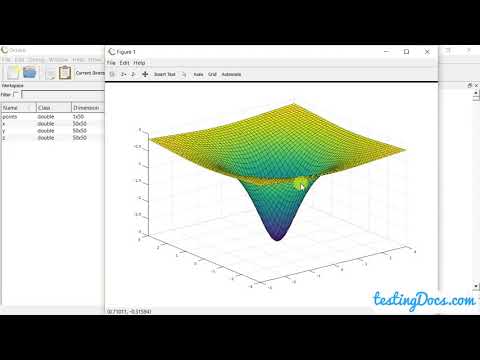
Output


Surf plot Example
—
Octave Tutorials
Octave Tutorial on this website can be found at:
https://www.testingdocs.com/octave-tutorial/