

Overview
In this tutorial, we will learn how to produce a two-dimensional plot using Octave. Octave has the ability to plot and visualize the data in many different ways. Octave has the capability to plot data in both 2D and 3D.
Two-dimensional plot
The 2D plot has two axes i.e x-axis and the y-axis. The basic 2D plot function in Octave is the plot command.
Syntax
plot(x,y);
x and y represent the vectors of the (x,y) coordinates in two-dimensions.
In order to plot a graph of the function y = f (x), we use the Octave command plot(x,y). To learn more about the Octave plot command:
https://www.testingdocs.com/octave-plot-command/
We need to define both the vectors x and y and pass them to the plot command.
We will use the Command Window prompt to create a simple plot. The following is a simple example to plot the straight-line function.
y = x
Steps
Create x vector. This will create a x vector with 10 x coordinate numbers.
>> x = 1:10
x =
1 2 3 4 5 6 7 8 9 10
Create y vector. This will create a y vector with 10 y coordinate numbers. The function here is y = x. Alternatively, we can assign y = x.
>> y = 1:10
y =
1 2 3 4 5 6 7 8 9 10
Pass the vectors to the plot command.
>> plot(x,y)
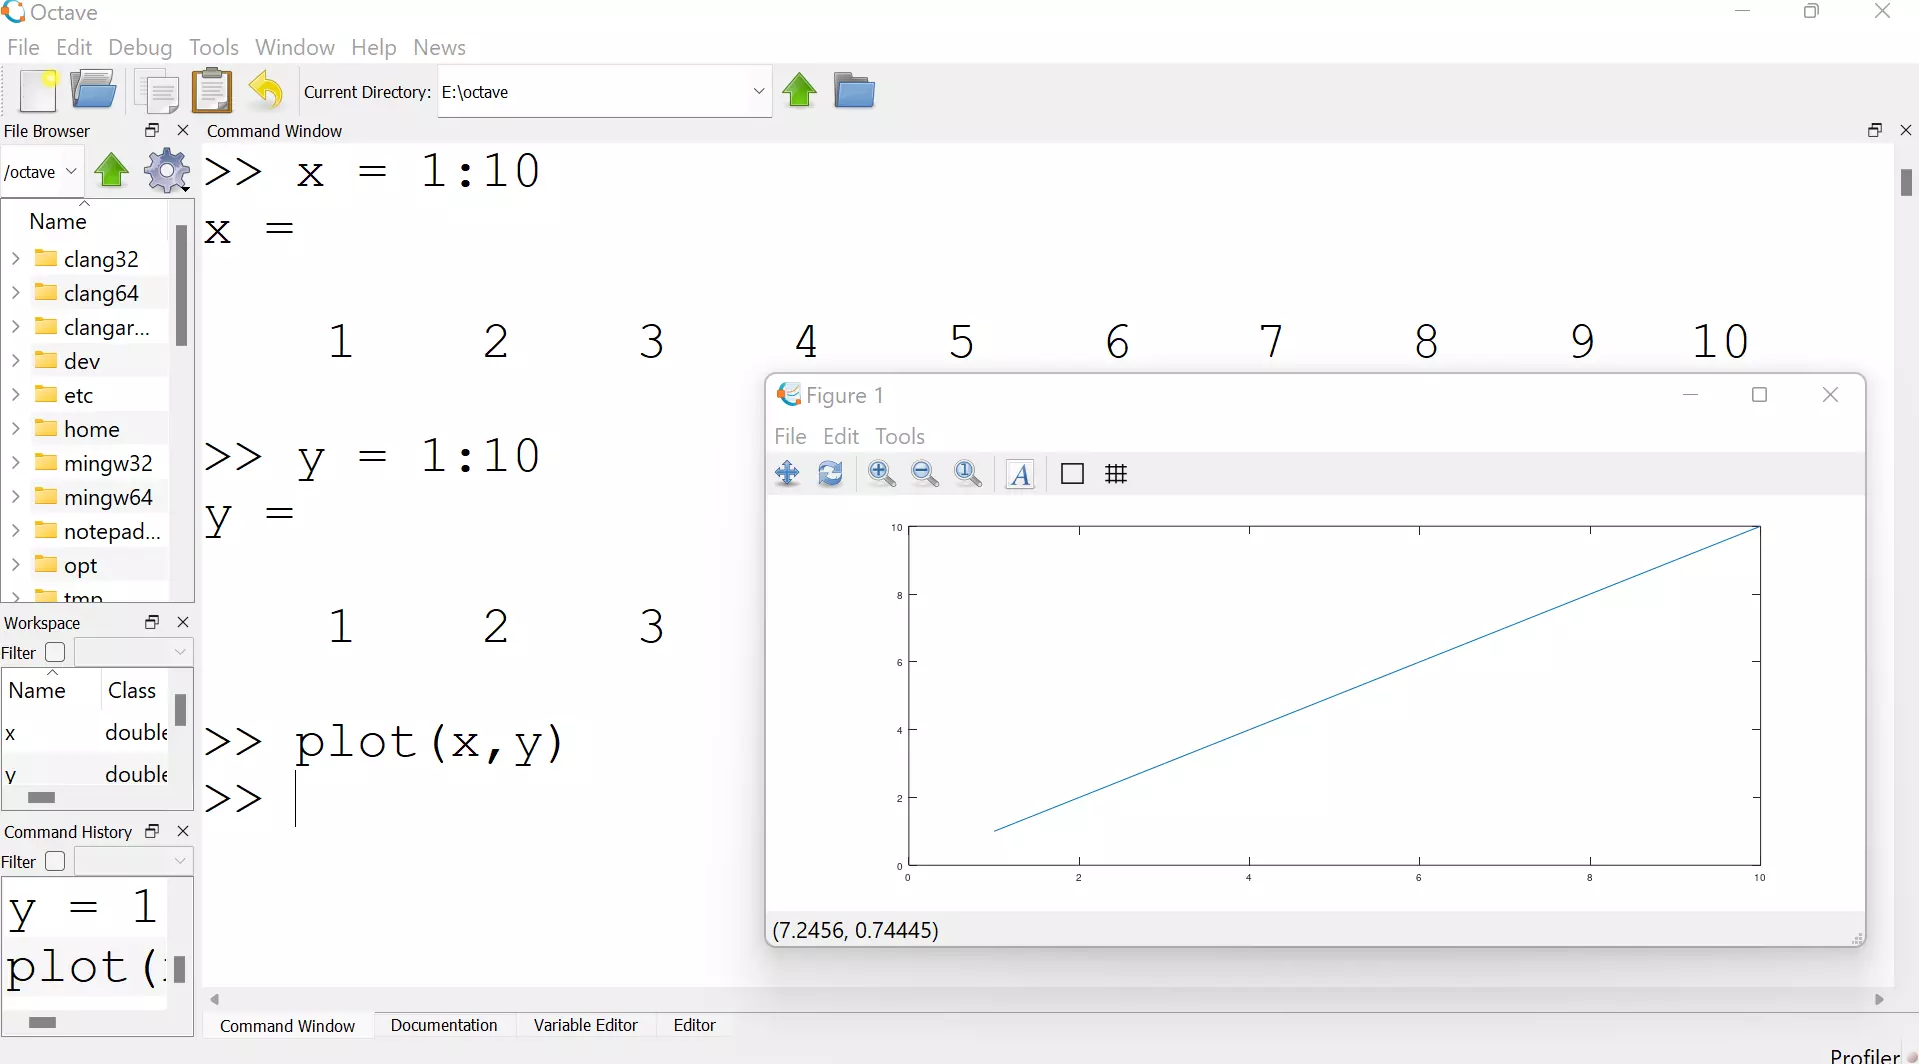

A new Figure window will open with the plot for the function.
There are several 2D plot functions available in Octave. Some of the functions are as follows:
- bar
- hist
- pie
- scatter
- loglog
- semilogx
- semilogy
In this article, we have run the Octave commands from the Command Window prompt. It’s recommended to write Octave code in Script files and save them. This approach makes it easy to run, test and debug the Octave code.
—
Octave Tutorials
Octave Tutorial on this website can be found at:
https://www.testingdocs.com/octave-tutorial/
More information on Octave can be found on the official website:
https://www.gnu.org/software/octave/index