

Overview
We can use the graphic debugger of the Eclipse IDE to debug the Java program. Let us see how to debug a program.
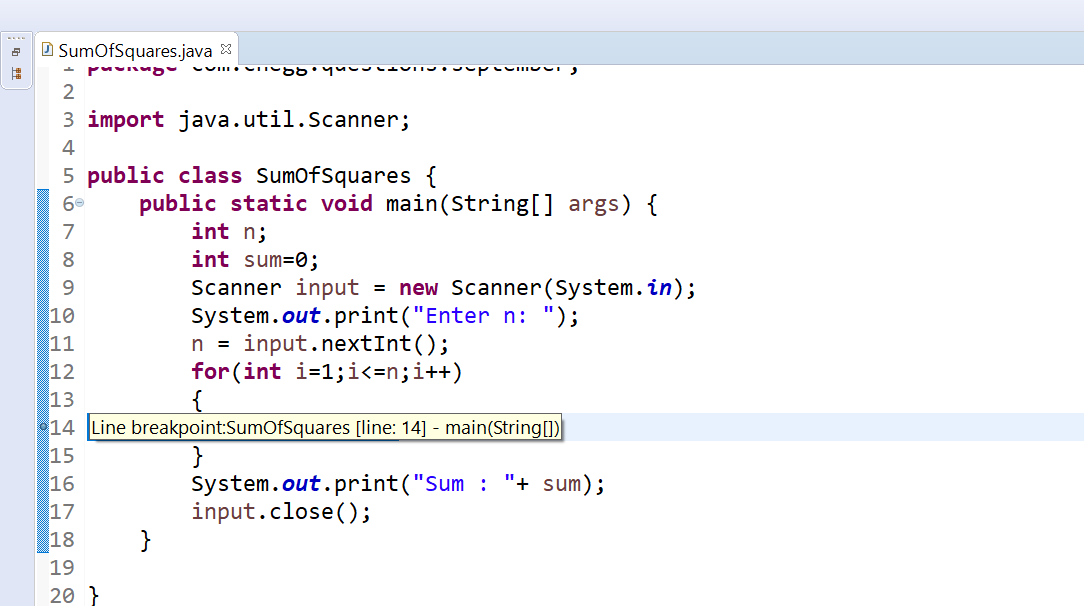
Set a Breakpoint
A breakpoint suspends program execution for you to examine the value of variables of the Java program under Debug. In order to examine the value of variables, you need to set at least one breakpoint to suspend the execution inside the program. You can set a breakpoint function by double-clicking on the left margin of the program window. A blue dot appears indicating a breakpoint is set at that line of code.(As illustrated in the following diagram)

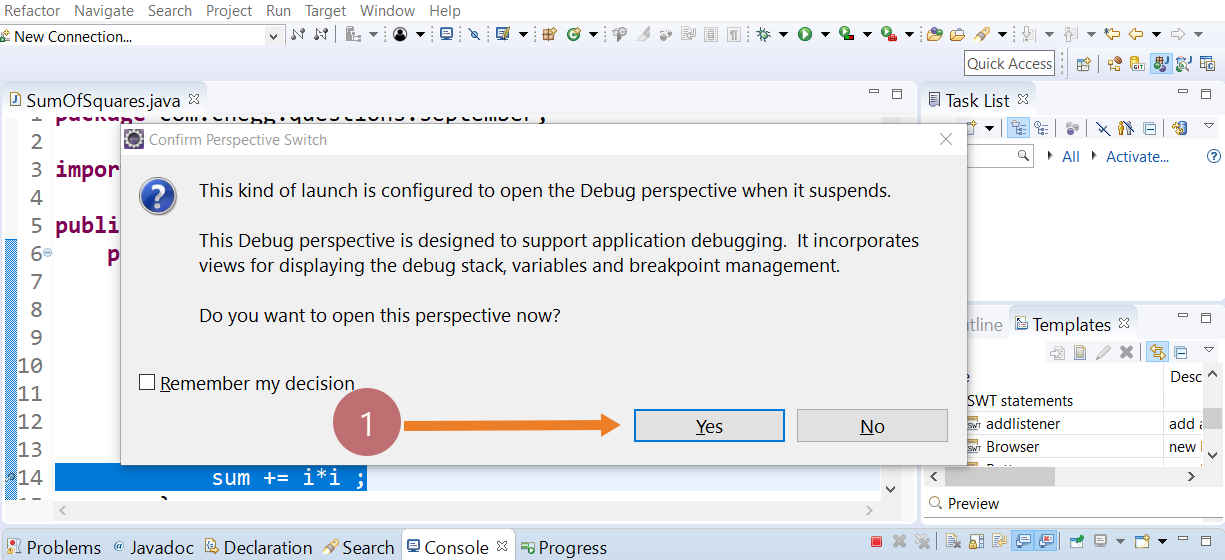
Start Debugger
Right-click on the project use Debug As >> Java application to switch into “Debug” perspective. Choose Yes on the debug perspective switch window. The program begins execution but suspends its operation at the breakpoint. Debug perspective is designed to support java program debugging. It facilitates views for displaying the debug stack, variables, and breakpoints, etc.

Useful Debug operations
Step-Over each step of the program to examine the value of the variables and expressions.
Step-Over and Watch the Variables and Outputs. You can also place your cursor at any variable to inspect the content of the variable.
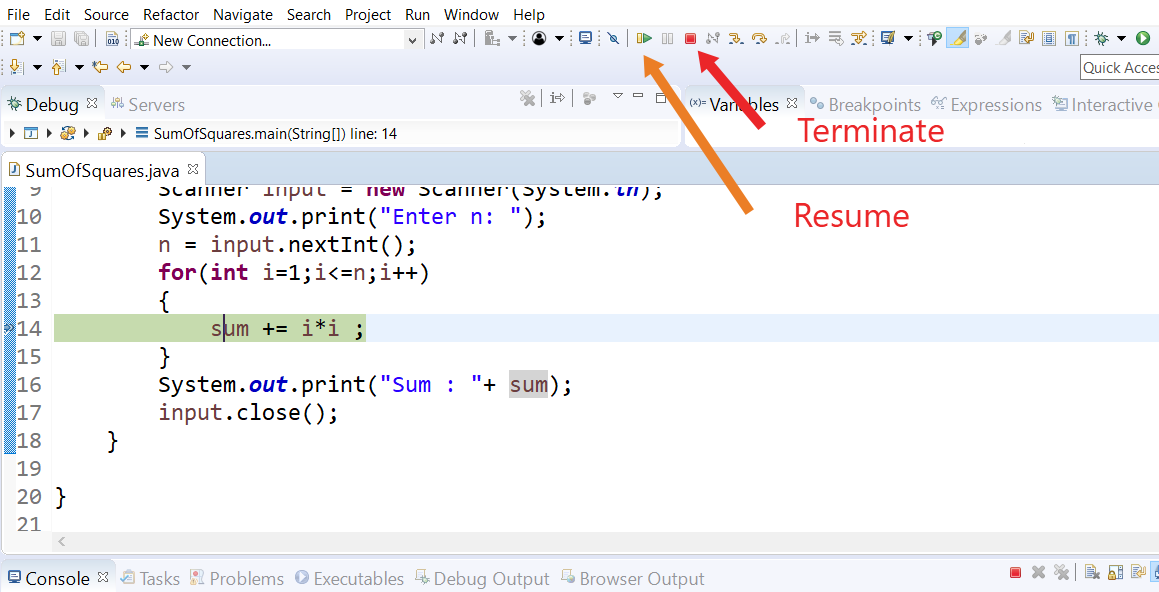

Resume(F8) continues the program execution, up to the next breakpoint, or till the end of the program.
Terminate ends the debugging session. Always terminate your current debugging session using Terminate or Resume(F8) till the end of the program.
—
Java Tutorial on this website: https://www.testingdocs.com/java-tutorial/
For more information on Java, visit the official website :
https://www.oracle.com/in/java/