

Introduction
In this tutorial, we will learn the steps involved in adding two graphs to the same figure. To achieve this we need to use subplots in the Octave script code. Subplots allow us to plot one or more plots in a single figure. In this example, let’s plot two sample functions sin(x) and cos(x) using GNU Octave.
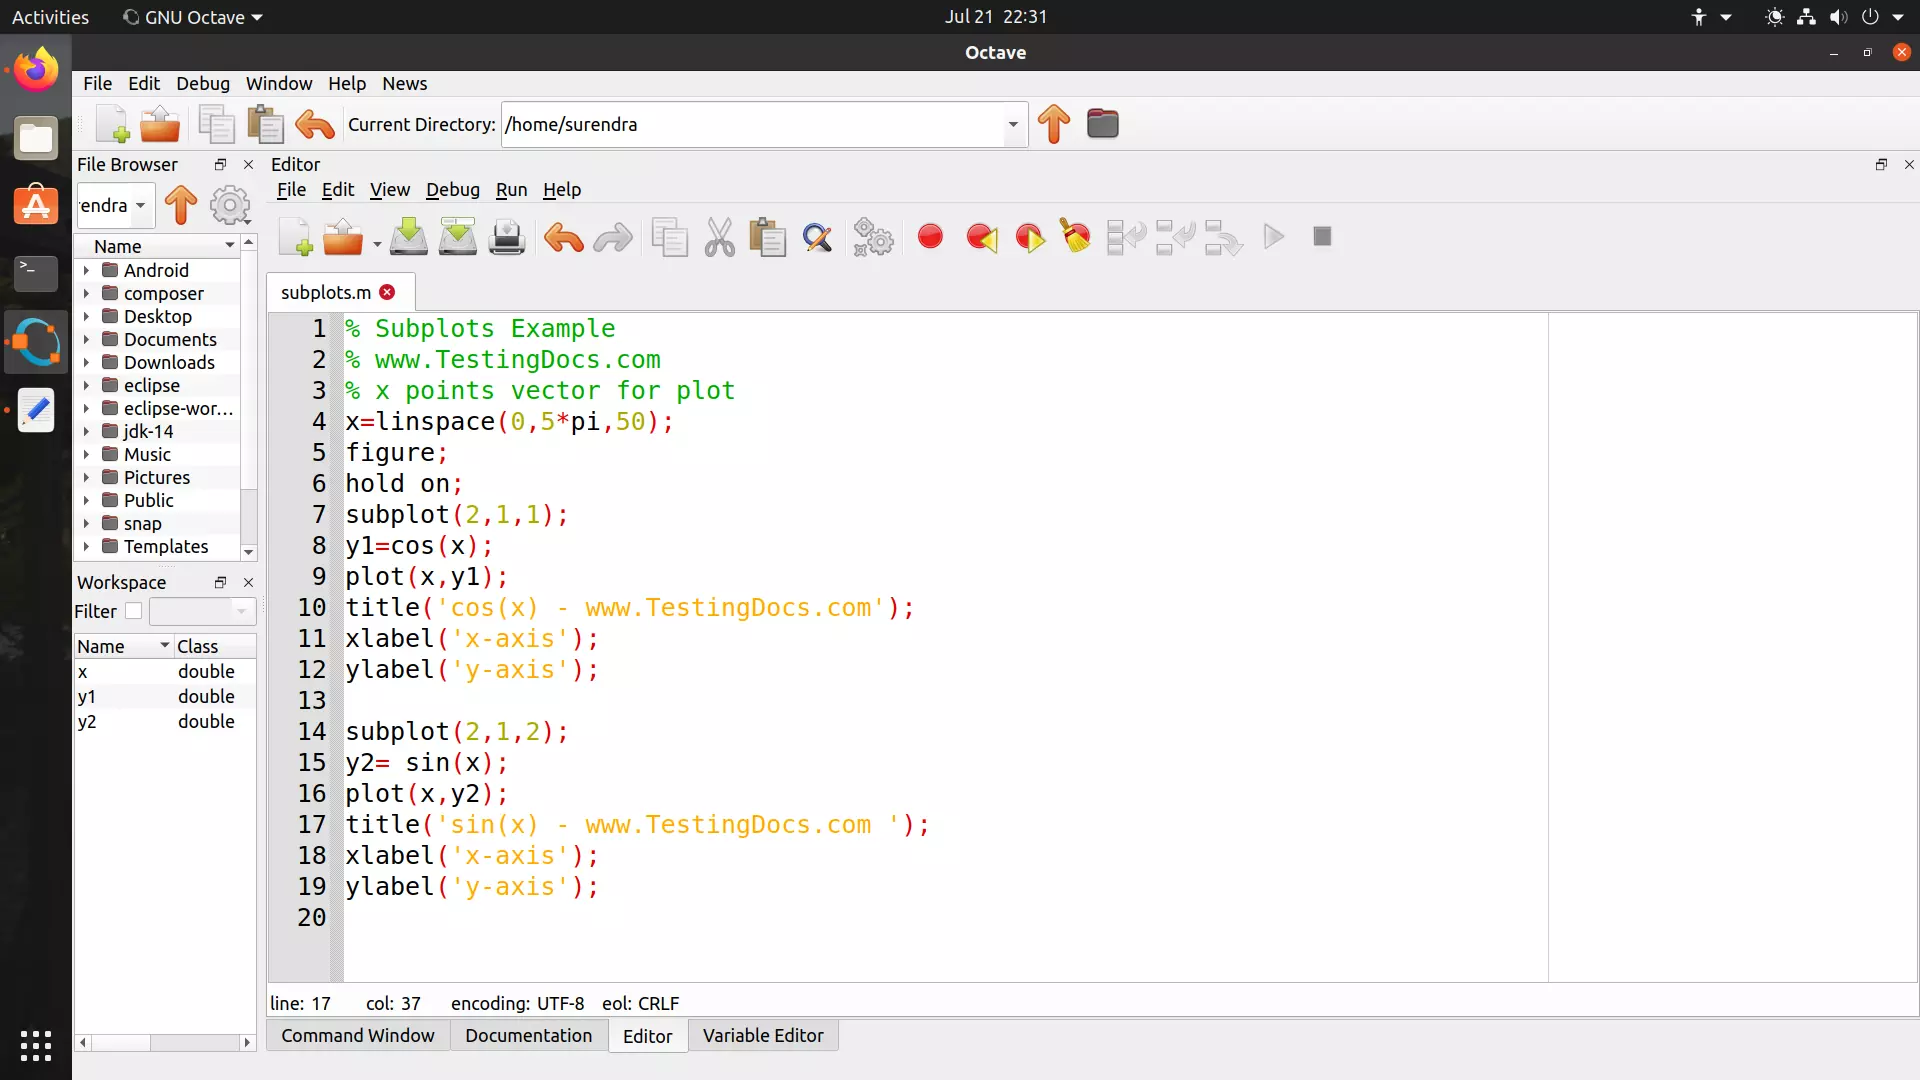
Octave Code
% Subplots Example
        % www.TestingDocs.com
        % x points vector for plot
        x=linspace(0,5*pi,50);
        figure;
        hold on;
        subplot(2,1,1);
        y1=cos(x);
        plot(x,y1);
        title('cos(x) - www.TestingDocs.com');
        xlabel('x-axis');
        ylabel('y-axis');

        subplot(2,1,2);
        y2= sin(x);
        plot(x,y2);
        title('sin(x) - www.TestingDocs.com ');
        xlabel('x-axis');
        ylabel('y-axis');

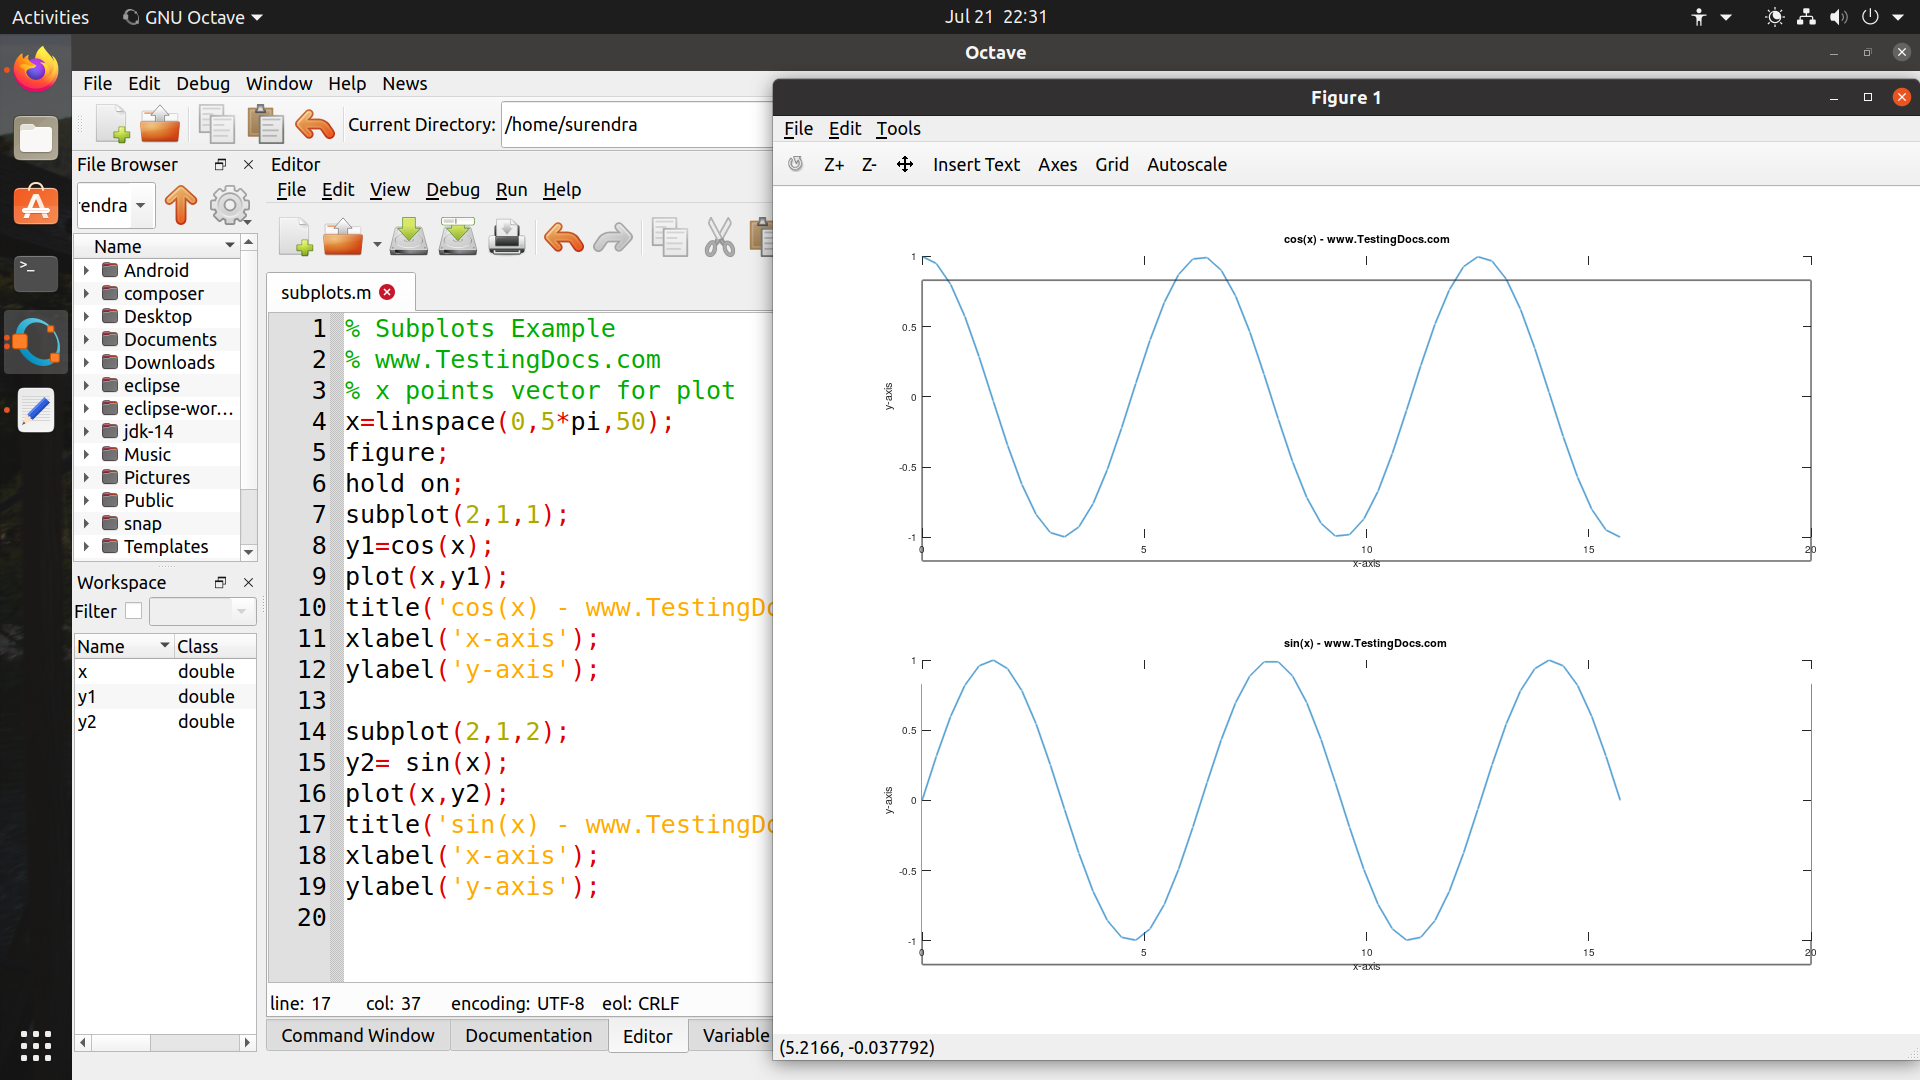
Screenshot
Octave Tutorial on this website can be found at:
https://www.testingdocs.com/octave-tutorial/
More information on Octave can be found on the official website:
https://www.gnu.org/software/octave/index