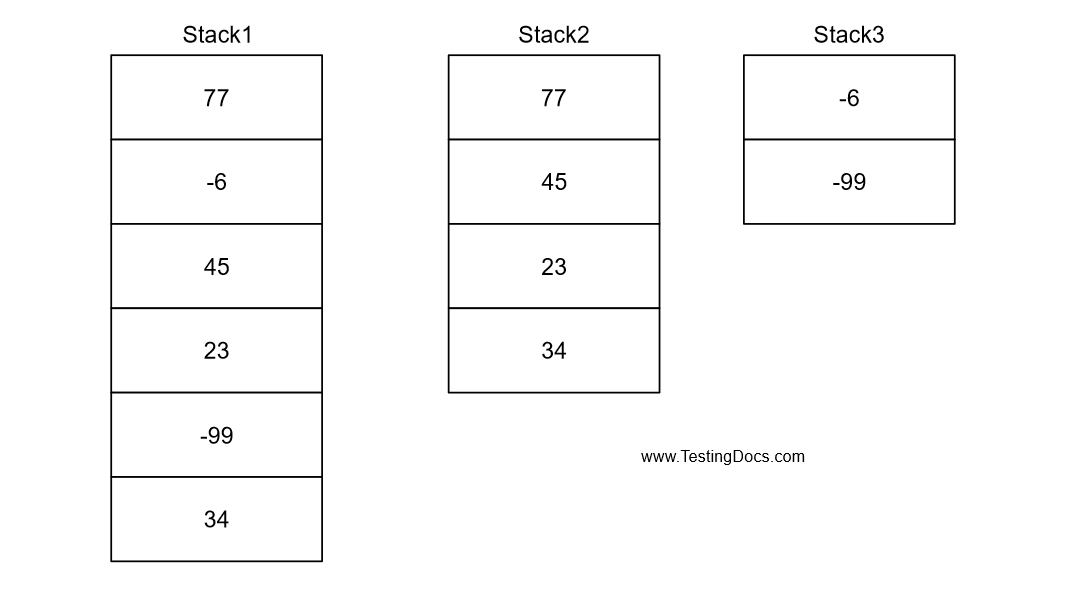
Design a Stack to separate positive and negative values
Problem Statement Design a Stack with all standard functions and an additional method that moves all positive values from a stack into a second stack and all the negative values into a third stack. Condition for the additional method to be met: The values moved into the second and third stacks must maintain their original […]