Which command displays the current working directory in Linux?
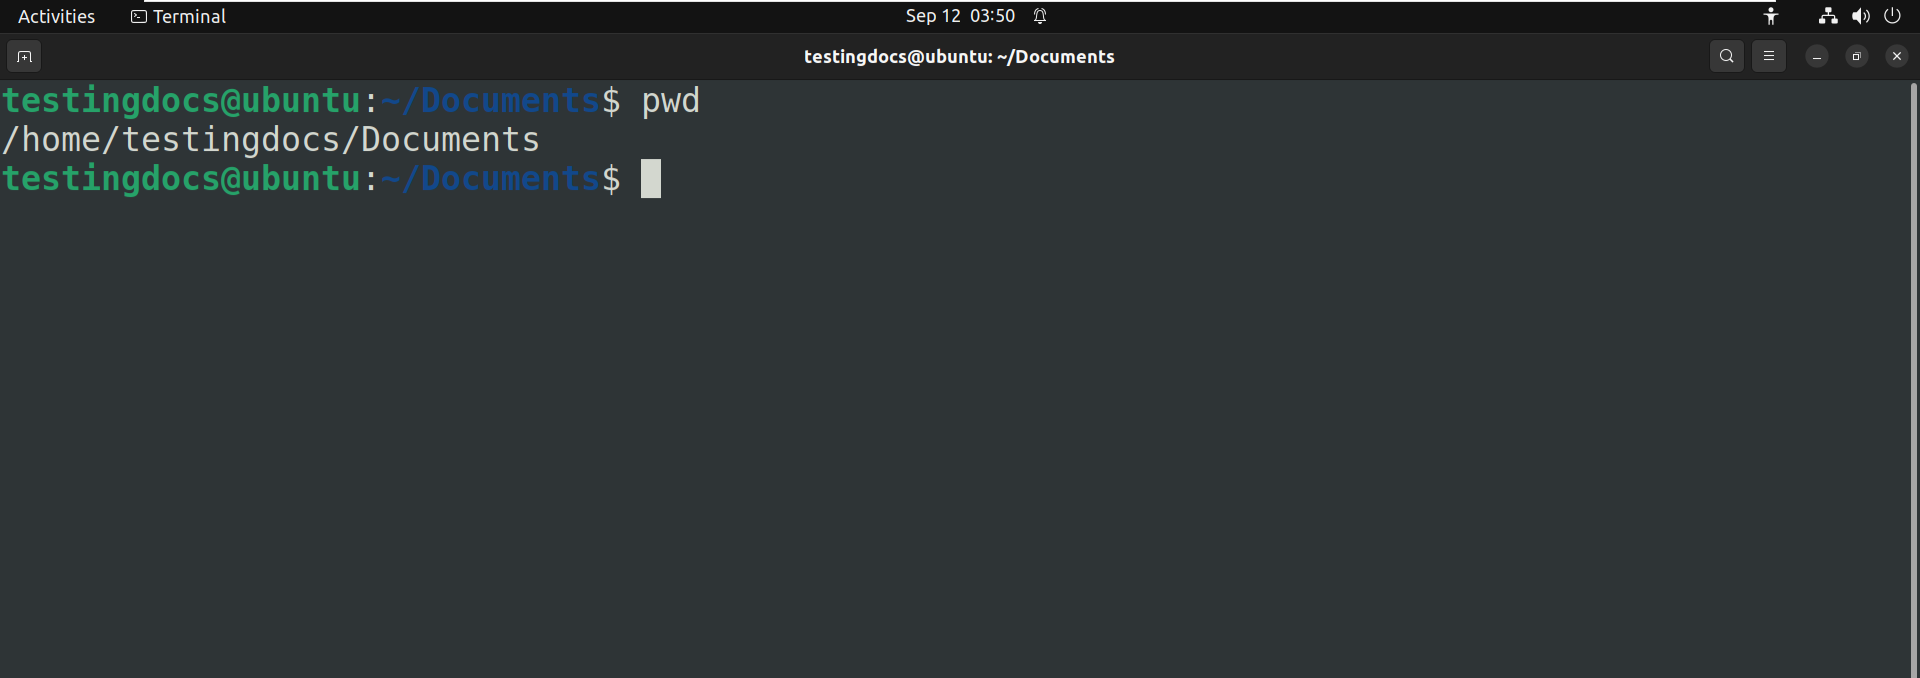
Which command displays the current working directory in Linux? Choose the correct option from the following options A) ls B) pwd C) cd D) mkdir Correct Answer B) pwd Explanation pwd stands for “print working directory.” When you run this command, it displays the full path of the current directory you are working in. For […]