How to iterate over a vector in Octave Script?
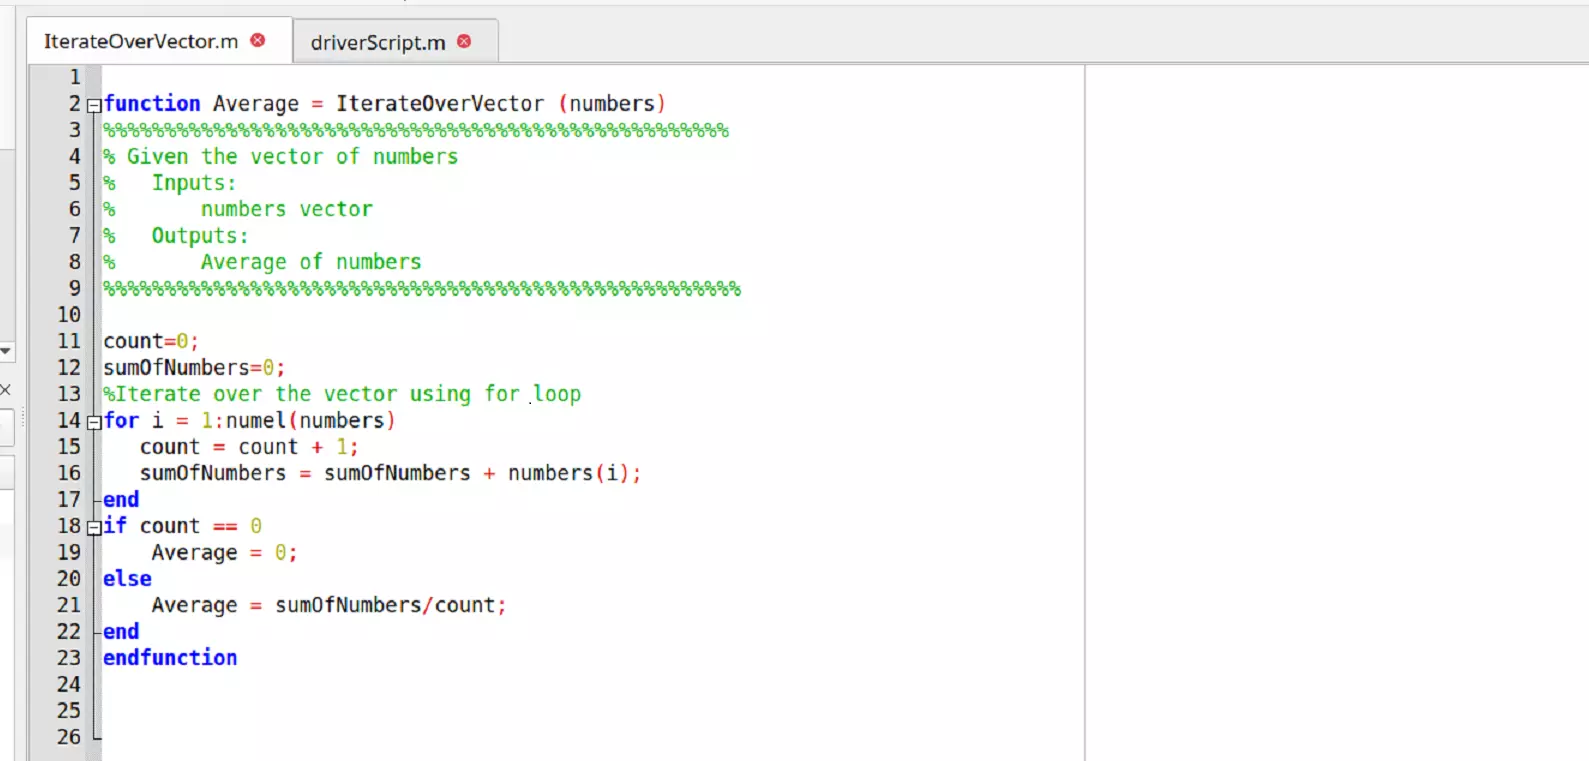
Introduction In this tutorial, let’s learn how to iterate over a vector in the Octave script. We will write an octave script to compute the average of numbers in a vector. We will iterate the vector using a for a loop. Octave Script function Average = IterateOverVector (numbers) %%%%%%%%%%%%%%%%%%%%%%%%%%%%%%%%%%%%%%%%%%%%%%%%%%% % Given the vector of numbers […]