Plotting data with Octave
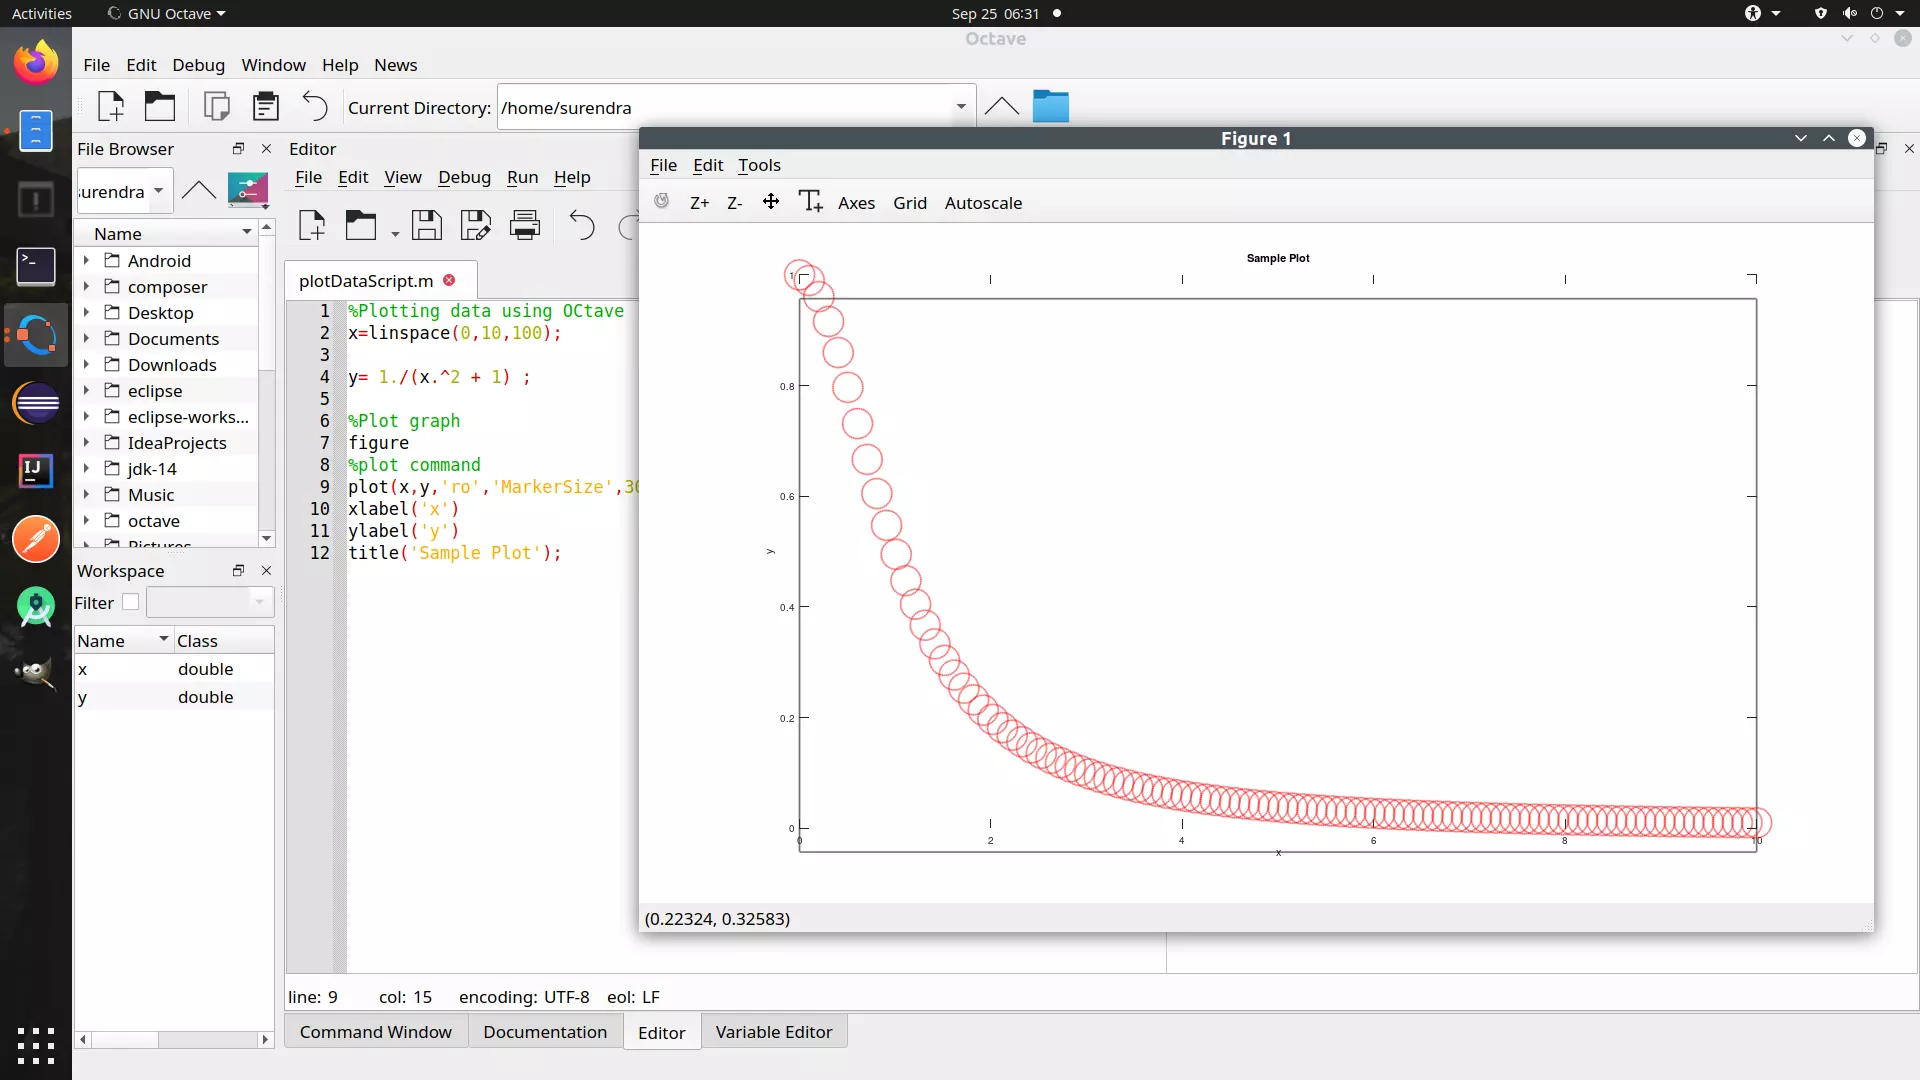
Plotting data with Octave In this tutorial, we will learn detailed steps to plot data using an Octave script. Sample function We can choose any function. Let’s choose a simple function y defined as: y= 1/(x^2 + 1); Generate x vector with some sample points from 0 to 10. x=linspace(0,10,100); Calculate y vector. y= 1./(x.^2 […]