3D Surface Plot Example using Octave
Introduction
In this tutorial, we will learn to plot a 3D Surface plot using Octave. Useful functions to plot in 3D are as follows :
- linspace
- meshgrid
- surf
Code Listing
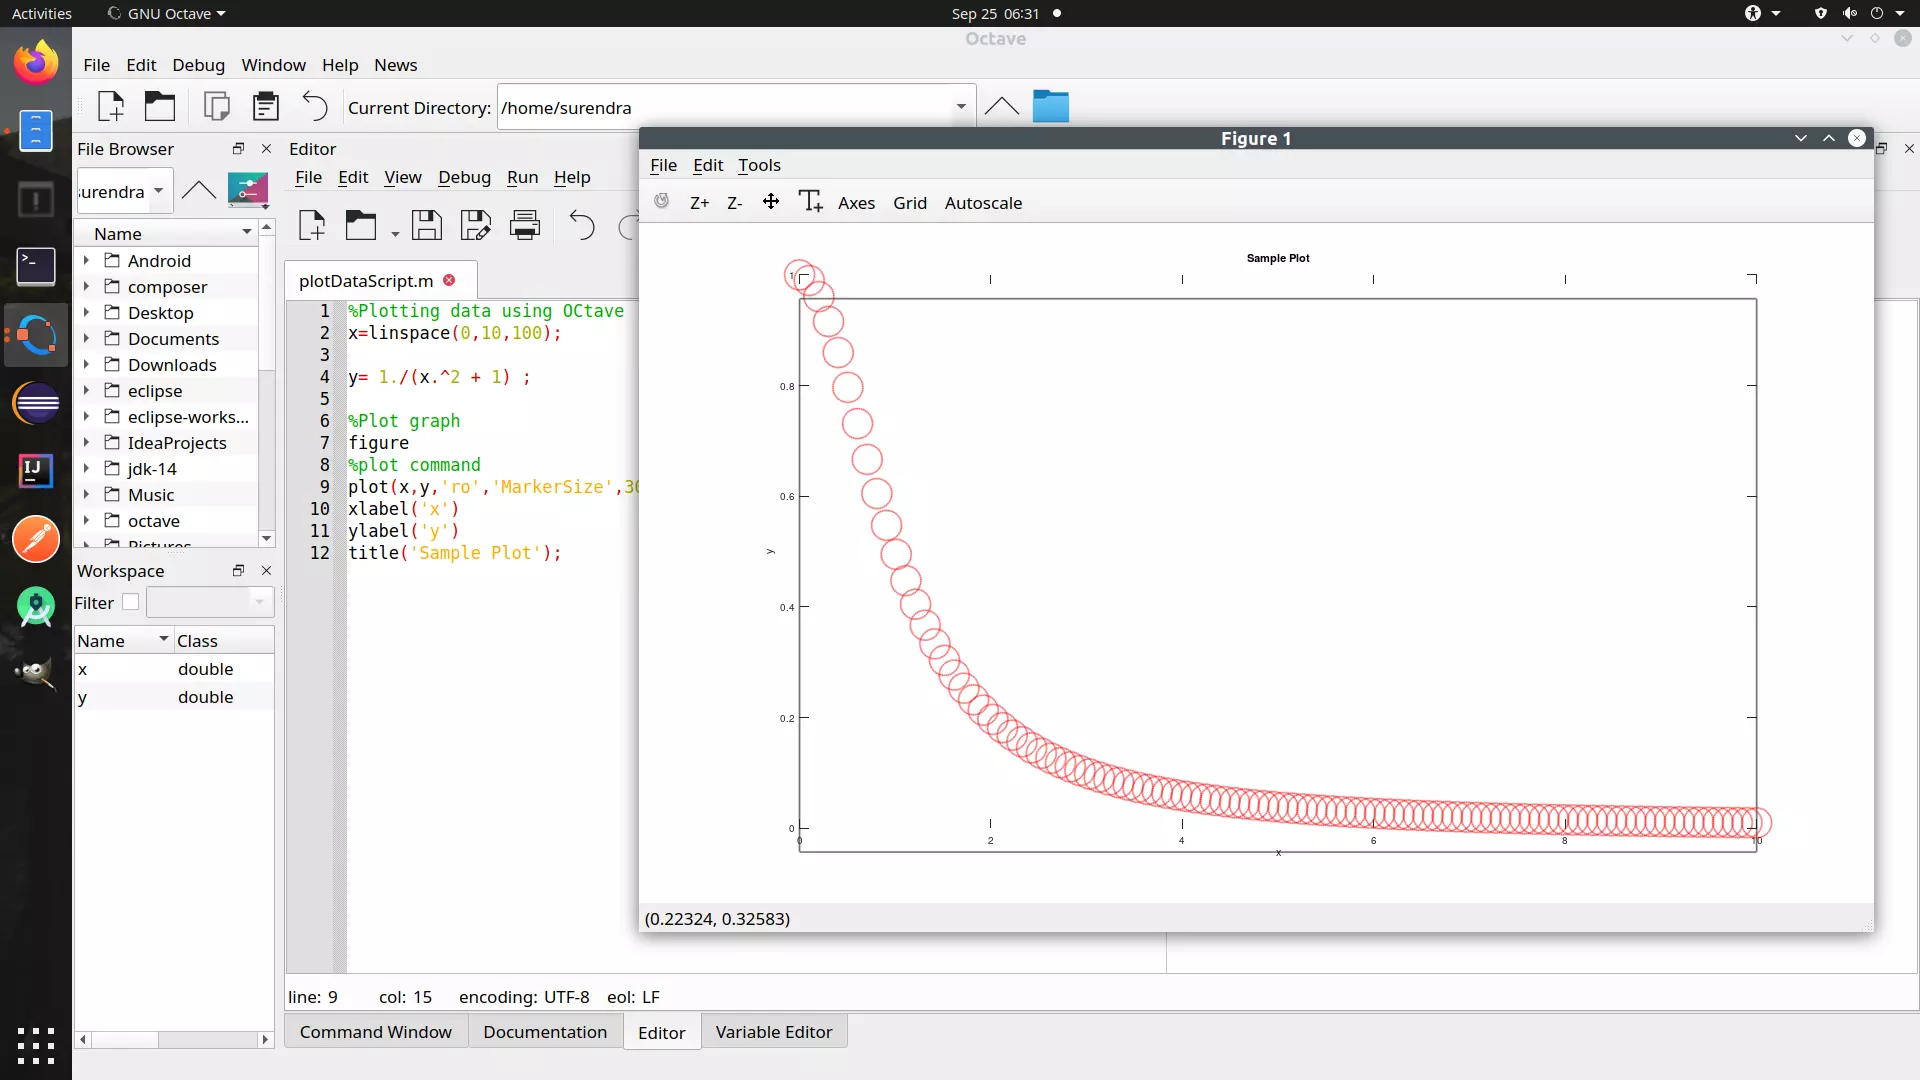
% 3D Surface Plot Example
        % www.TestingDocs.com
        points = linspace(-3,3,100);
        [x,y] = meshgrid(points,points);
        z= -3./(1+ x.^2 + y.^2);
        surf(x,y,z);
        xlabel("x-axis");
        ylabel("y-axis");
        zlabel("z-axis");
        title("Surface Plot Example - www.TestingDocs.com");

Screenshot

Notes
linspace (start, end, n)
linspace returns a row vector with n linearly spaced elements between the start and end
parameters.
meshgrid(x,y)
meshgrid returns the 2D grid matrices for the passed x and y vectors.
surf
surface mesh is plotted with the output of the meshgrid 2D matrices.
To know more about any function use the doc command in the command window.
>> doc <functionName>
For example, to know more about linspace function usage, type the command :
>> doc linspace
——————————–
Octave Tutorial on this website can be found at:
https://www.testingdocs.com/octave-tutorial/
More information on Octave can be found on the official website:
https://www.gnu.org/software/octave/index