How to create a Sunburst chart in Excel
How to create a Sunburst chart in Excel
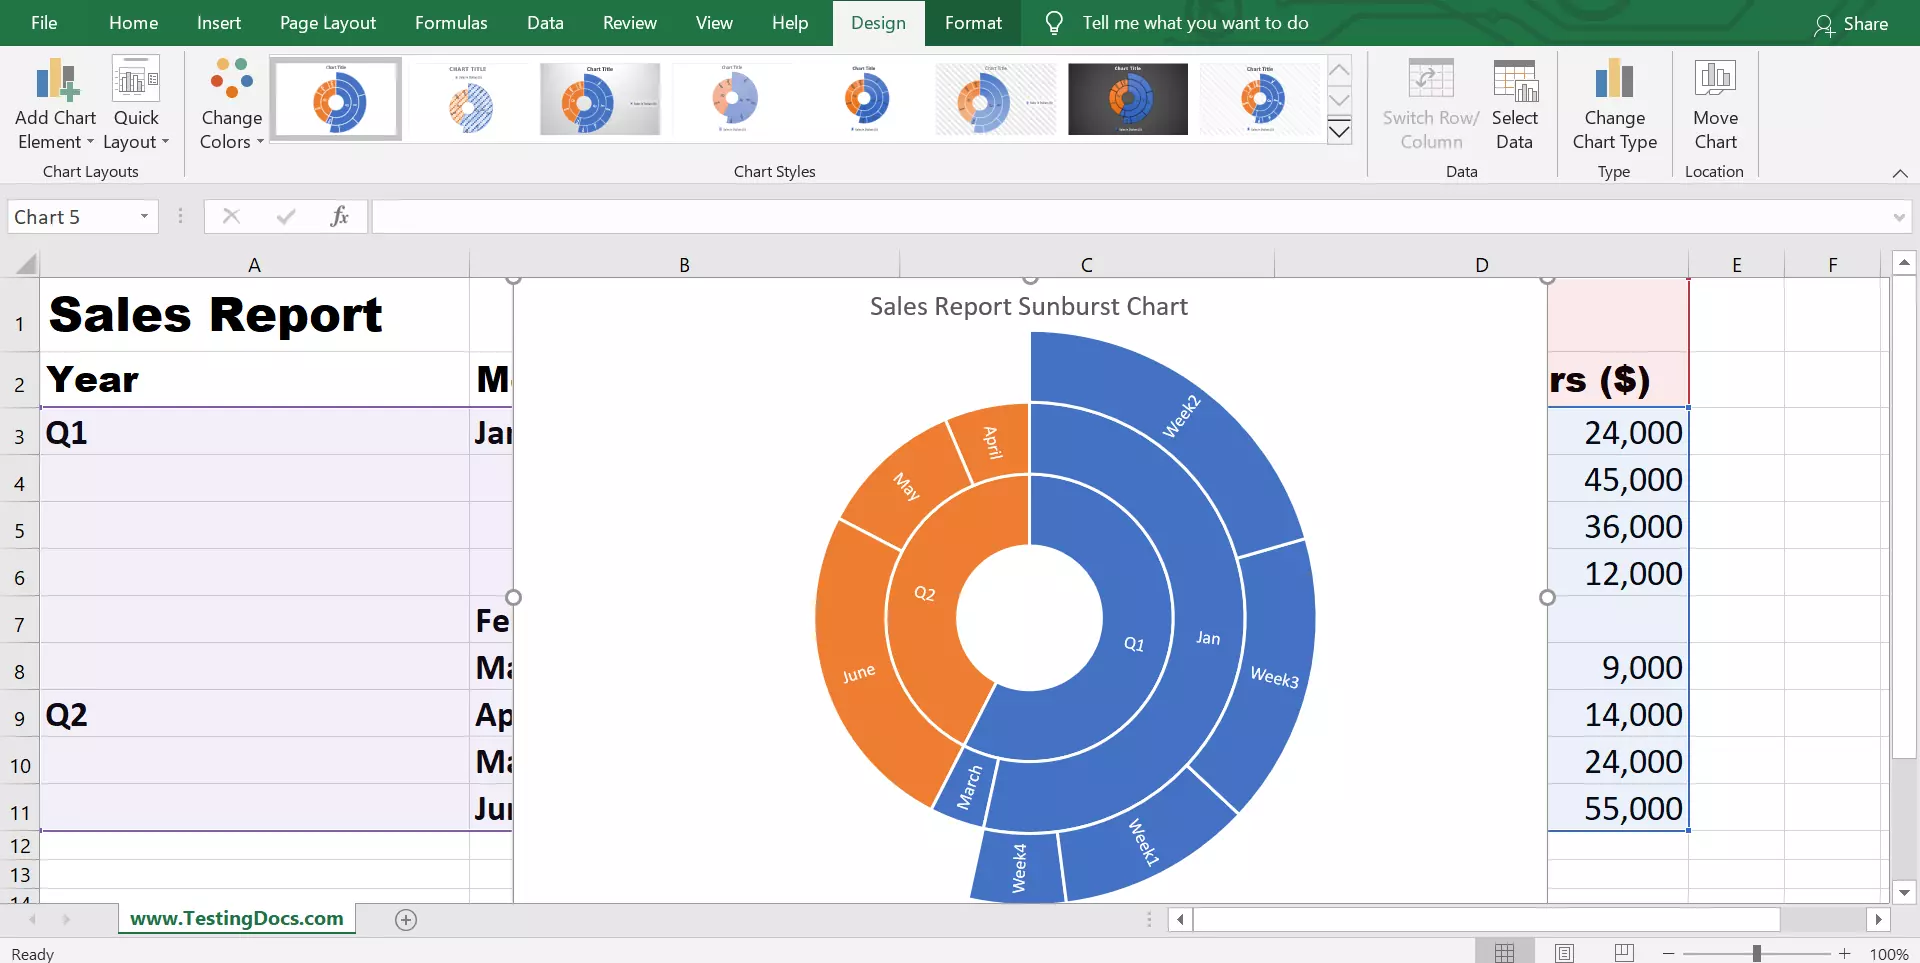
In this tutorial, we will go through the steps in creating a Sunburst chart in Excel. The sunburst chart, also known as a Ring chart, is a hierarchy chart used to compare parts to whole data types.
A Sunburst chart is a data visualization chart that shows hierarchical data using concentric circles. It’s particularly useful for displaying data with multiple levels of categorization.
Sample data
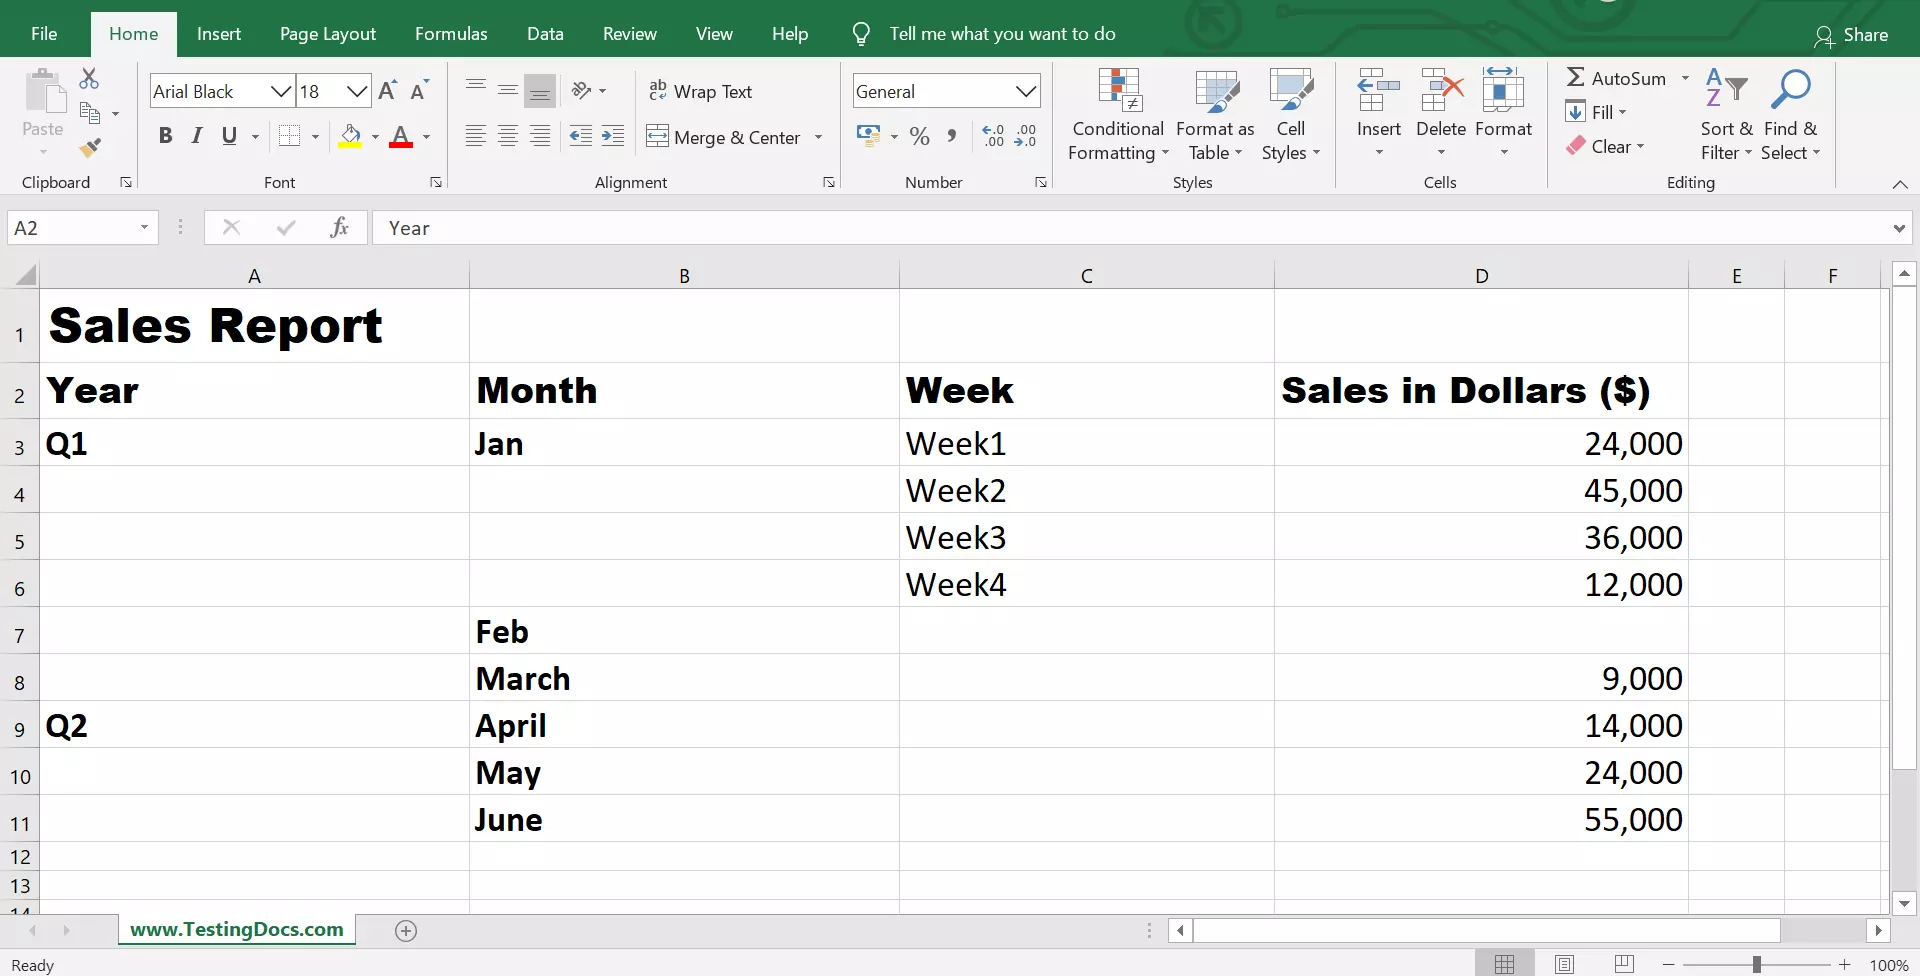
We would use a sample Sales report for two quarters and generate the Sunburst chart for the sales report.
Steps to create
Select the data for the chart.
Insert Sunburst chart
Click Insert >> Recommended Charts >> All Charts >> Sunburst.
or
Click Insert > Insert Hierarchy Chart > Sunburst.