How to specify Markers in Octave/Matlab Plot?
How to specify Markers in Octave/Matlab Plot?
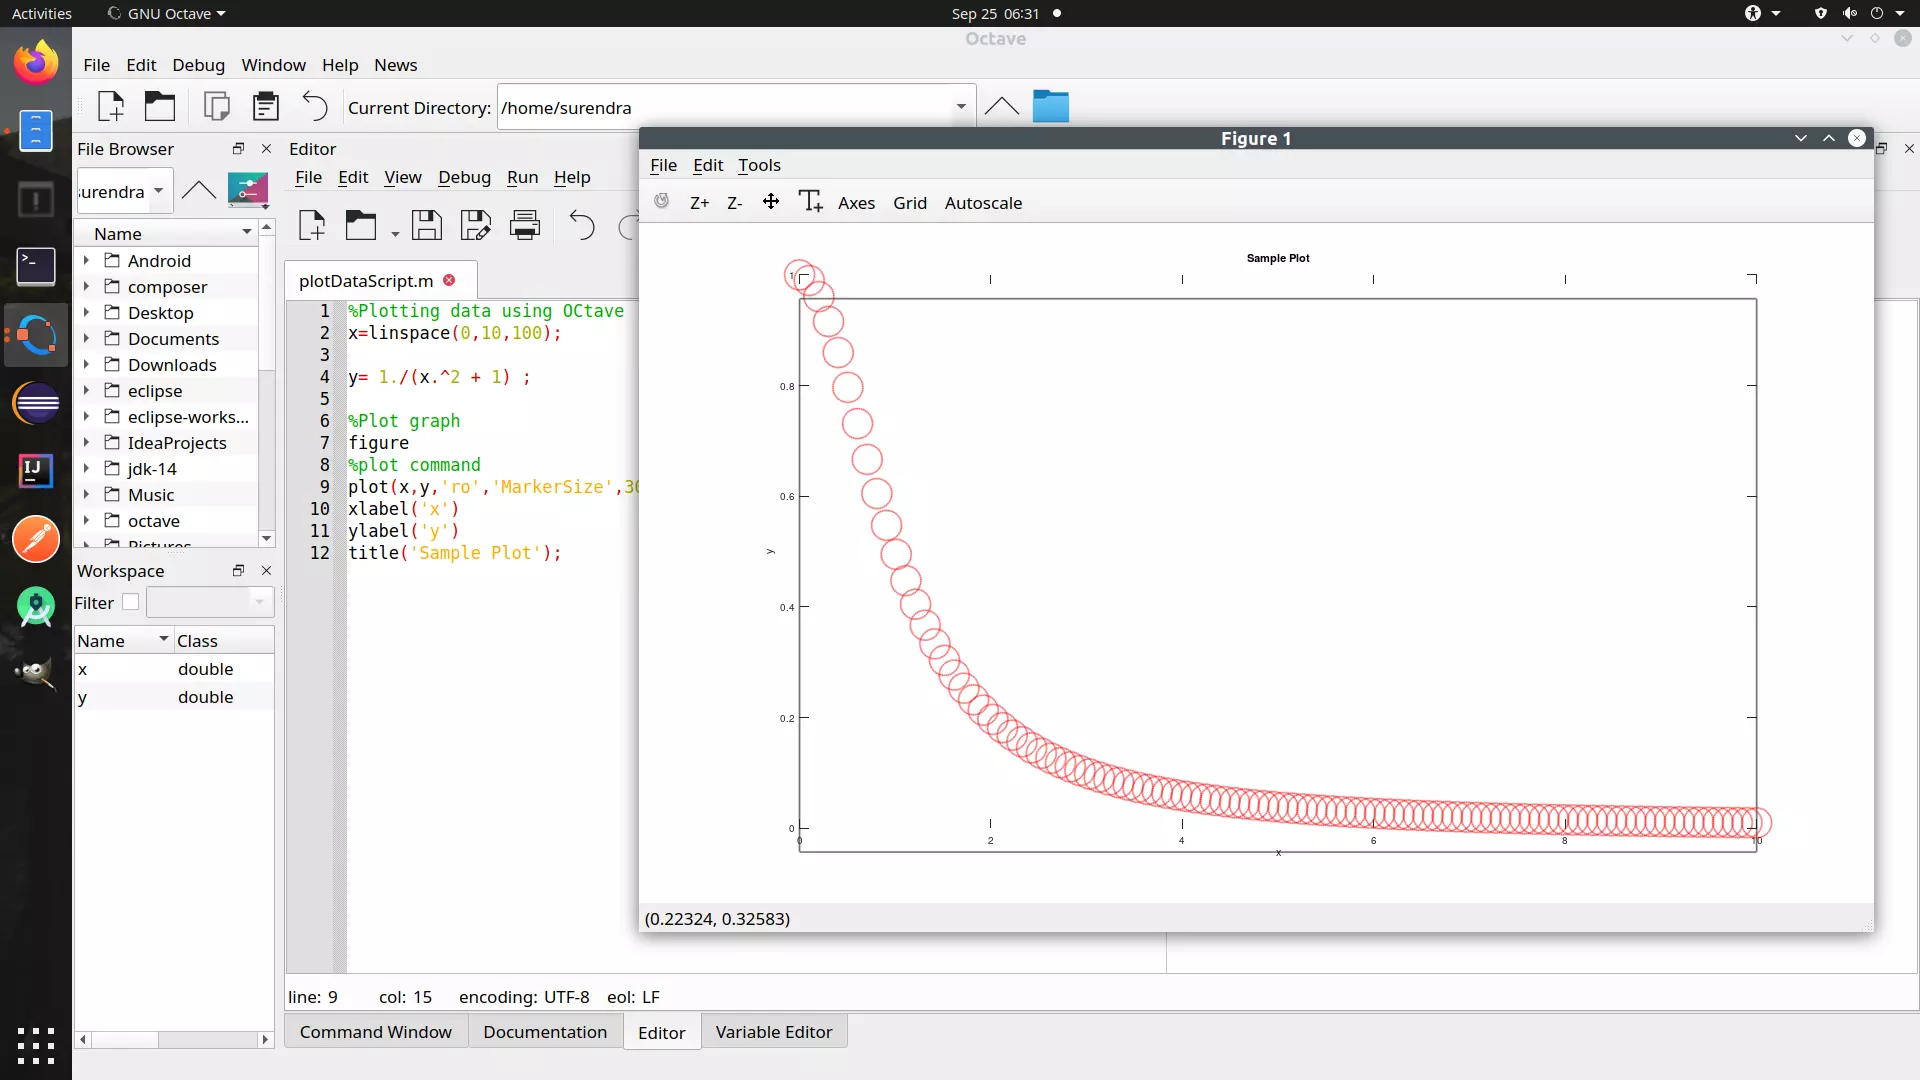
Let’s learn the steps involved to specify markers in the Octave/Matlab plot command with attributes like edge color, face color, and marker size, etc. The octave script with comments shown below to plot the time vs velocity graph.
Octave Script
%%%%%%%%%%%%%%%%%%%%%%%%%%%%%%%%%%%%%%%%%%%%%%%%%%%%%%%%%%%
        % Sample Octave Plot
        % LineWidth       = 7.0
        % Plot line color = Blue
        % MarkerEdgeColor = Green
        % MarkerFaceColor = Red
        % MarkerSize      = 30
        %%%%%%%%%%%%%%%%%%%%%%%%%%%%%%%%%%%%%%%%%%%%%%%%%%%%%%%%%%%
        gravity=9.81  %m/s^2
        mass=60  %kg
        c=0.35

        %time vector
        time=linspace(0,30,30);

        %Calculate v
        velocity=sqrt(gravity*mass/c)* tanh(sqrt(gravity*c/mass).*time);

        %Plot graph
        figure
        %plot command
        plot(time,velocity,':bo','LineWidth',7.0,...
        'MarkerEdgeColor','g',...
        'MarkerFaceColor','r',...
        'MarkerSize',30)
        xlabel('time')
        ylabel('velocity')
        title('Sample Plot')

Plot with Marker
%plot command
plot(time,velocity,’:bo’,’LineWidth’,7.0,…
‘MarkerEdgeColor’,’g’,…
‘MarkerFaceColor’,’r’,…
‘MarkerSize’,30)
Screenshot

Octave Tutorial on this website can be found at:
https://www.testingdocs.com/octave-tutorial/
More information on Octave can be found on the official website:
https://www.gnu.org/software/octave/index