RAPTOR Chart for Multiplication Table
RAPTOR Chart for Multiplication Table
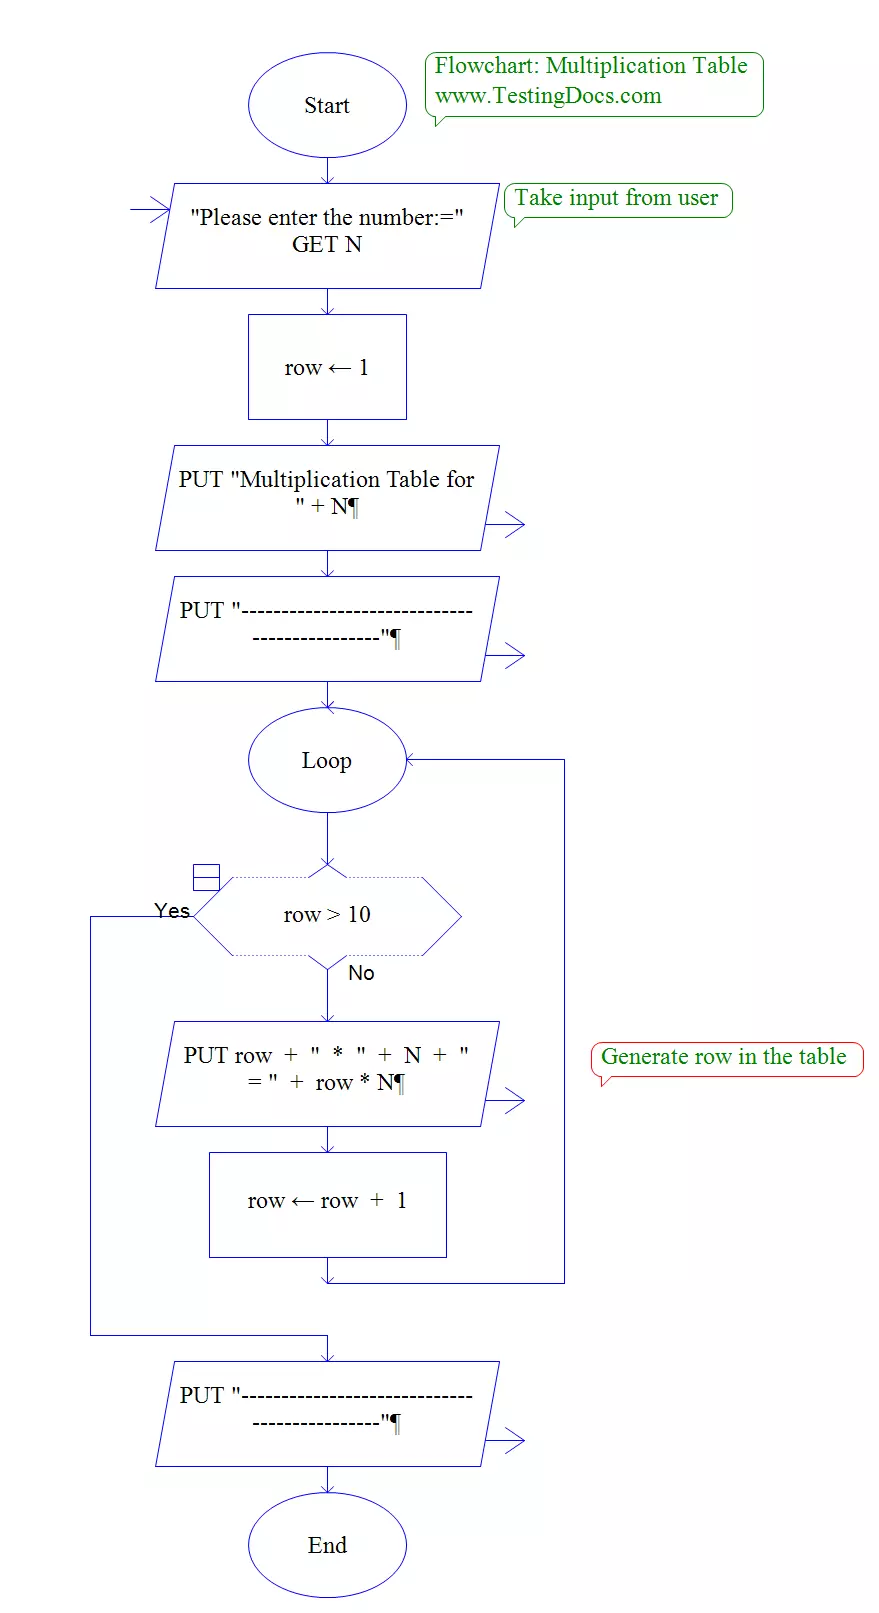
In this post, we will model a Raptor Flow chart for the Multiplication Table. The flowchart would prompt the user to enter the number for which the multiplication table would be displayed.
RAPTOR Flowchart
Let’s assume the table will have ten rows. The flow chart will generate ten rows for the table.
Sample Output
Sample output for input N= 10.
Note that the flowchart assumes valid input from the user.
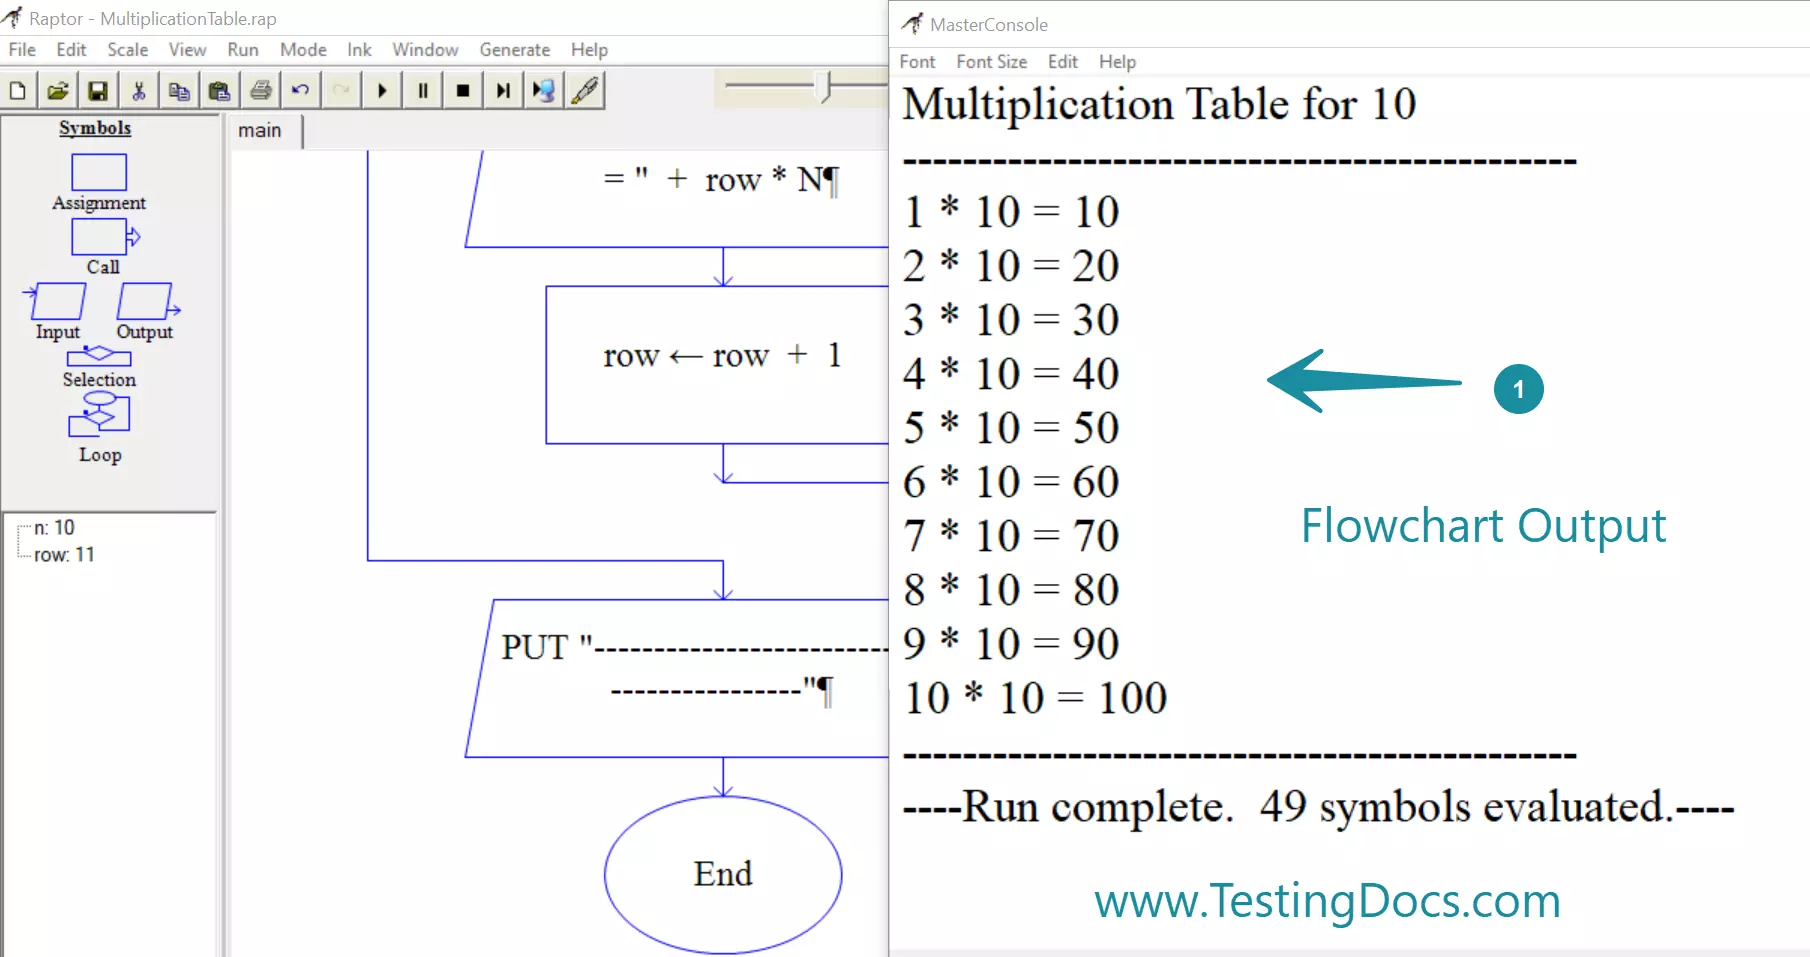
Flowchart Output
Multiplication Table for 10
———————————————
1 * 10 = 10
2 * 10 = 20
3 * 10 = 30
4 * 10 = 40
5 * 10 = 50
6 * 10 = 60
7 * 10 = 70
8 * 10 = 80
9 * 10 = 90
10 * 10 = 100
———————————————
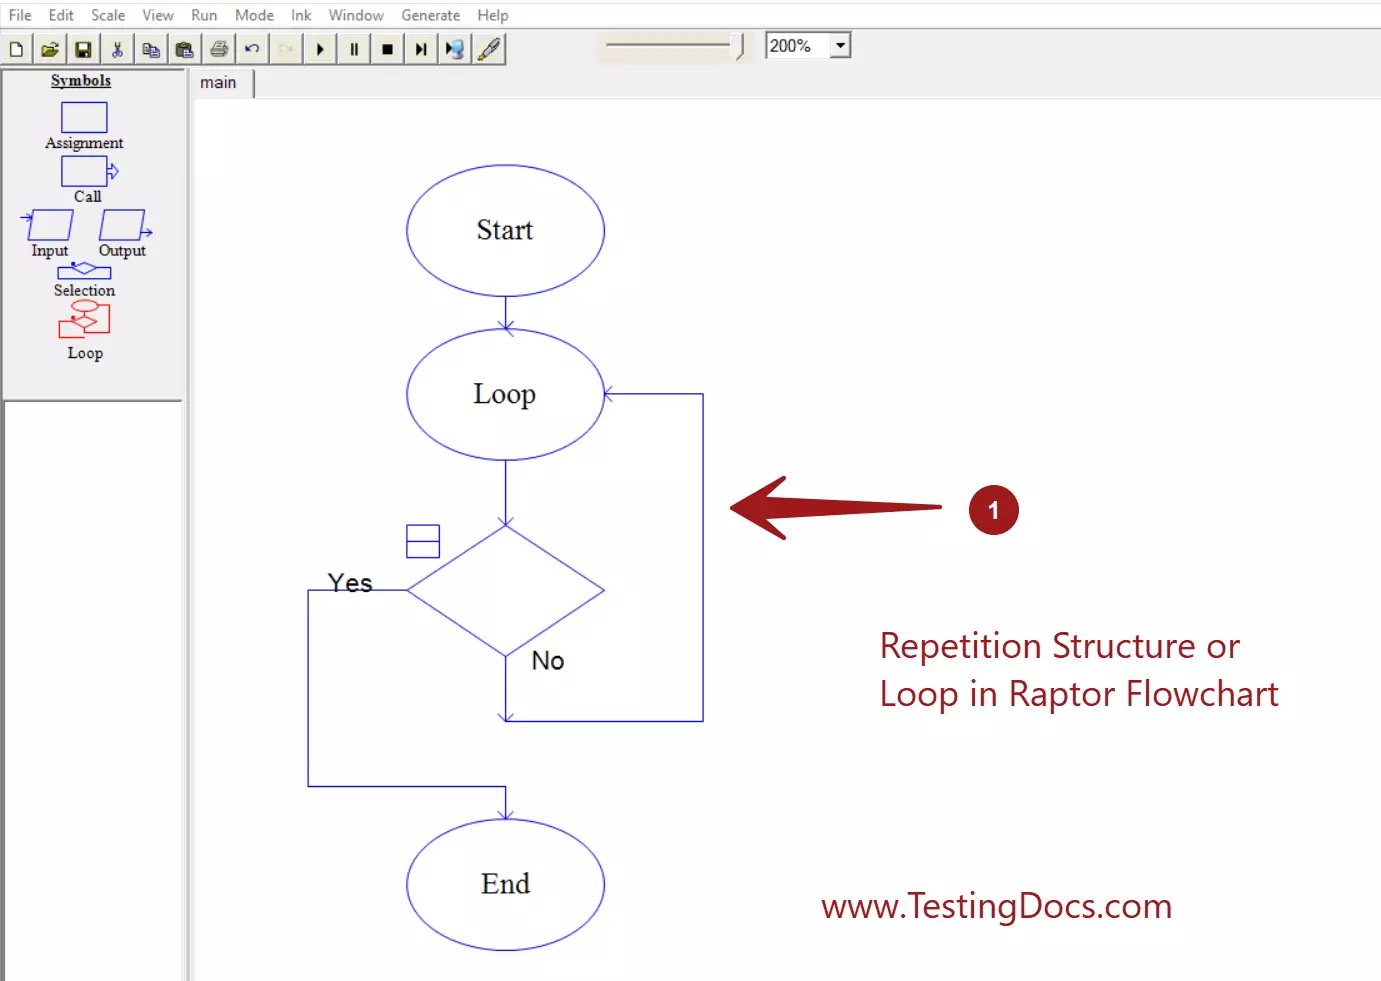
Each iteration in the loop(repetition structure) displays one row of the table. The loop terminates when the row is more than the number of rows in the table. i.e 10.
Enhancements
Constant for Table Row
We can further enhance the flowchart to include a constant for the table row count. Alternatively, we can declare a constant, such as TABLE_ROWS, and assign the value to the constant. We can now have the loop condition to check:
row > TABLE_ROWS
User Input validation.
As you can see, the user input for the variable N is not validated. We just assumed that the user would input a number. We can further enhance the flowchart to be defensive.
RAPTOR Tutorials
Raptor Tutorials on this website can be found at:
RAPTOR official website: