Taylor series expansion MATLAB
Taylor Series expansion MATLAB
In this post, we will learn a MATLAB program to compute the Taylor series approximation of a simple function like sin(x). We can also use these approximations for other functions and polynomials.
Taylor Series
Taylor series of a function f(x) is an infinite series at a point a and can be written as :
where
is the nth derivative of the function at point a. The series is also called the Maclaurin series when a = 0.
For more information:
- https://en.wikipedia.org/wiki/Taylor_series
Taylor Series Example
Let’s compute the Taylor series for sin(x) at point a = 0.
Apply the Taylor series expansion formula:
For a better understanding of the series, let’s calculate each term individually for the first few terms
The first tern would be =
The second term in the series =
The derivative of sin(x) = cos(x)
The third term in the series =
The second derivative of sin(x) = -sin(x)
The fourth term in the series =
We can ignore the even terms in the series containing sin(0) as sin(0) = 0.
We can generalize the series as follows:
Note that: cos(0) = 1
MATLAB Program
Function
function [out] = sinTaylorApprox(x, N)
% Input = x, N
% out vector : Taylor series approx of sin(x)
out=zeros(1,numel(x));

for i = 1 : numel(x)
    for k = 0: N
        out(i) = out(i)+ ( (-1)^k * (x(i))^(2*k + 1) ) / factorial(2*k + 1);
    end
end
end
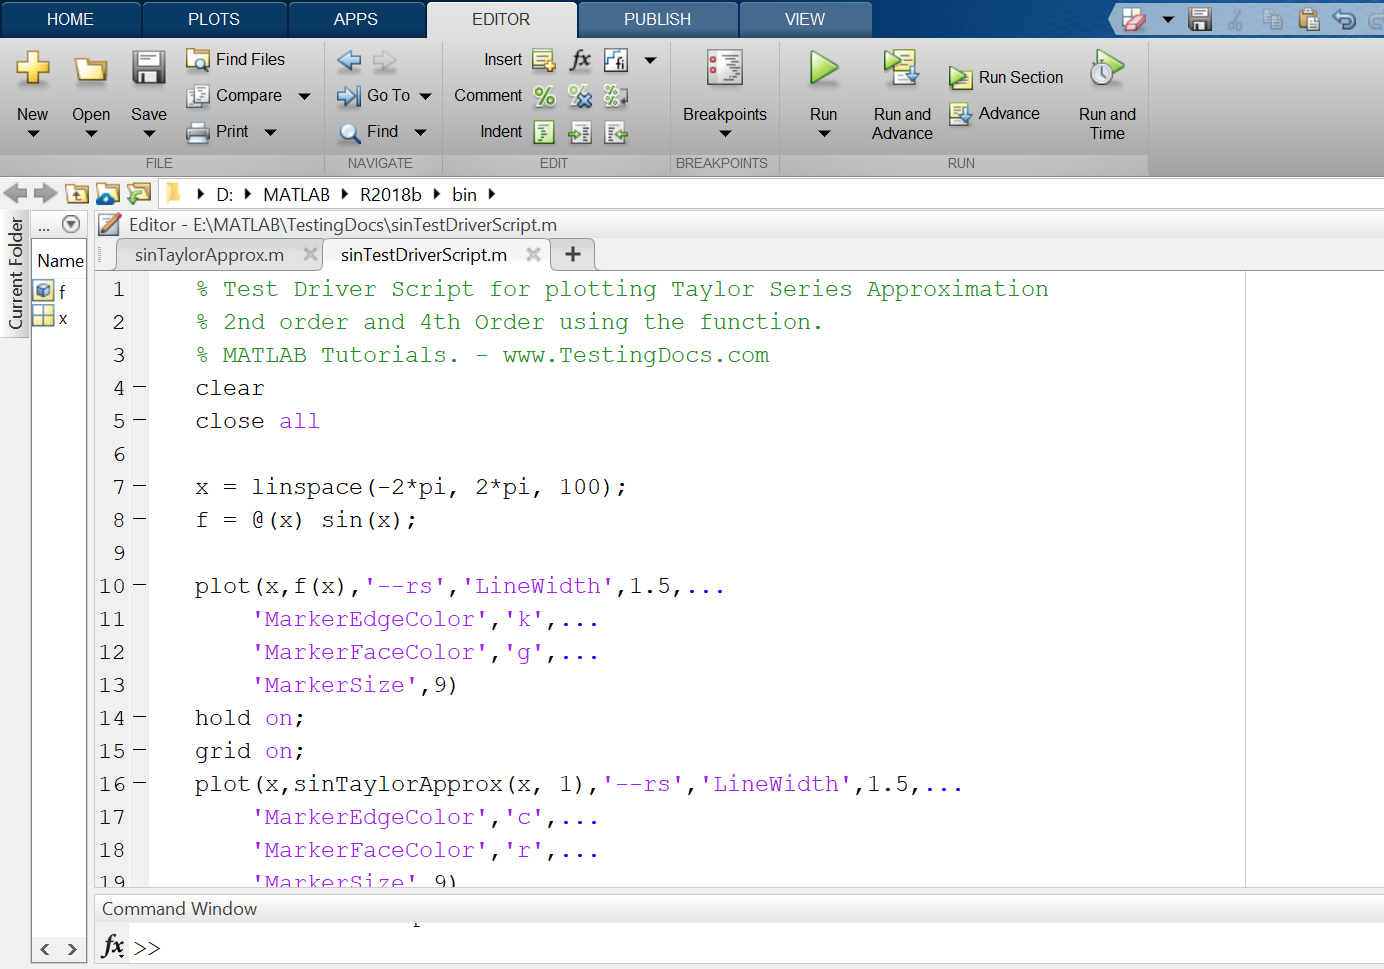
Test Driver Script
Using the defined function to compute the Taylor series approximation for the sin(x), we will create a driver script to plot the graphs for 3rd and 5th-order approximations.
The driver script invokes the function twice with input arguments.
% Test Driver Script for plotting Taylor Series Approximation
% 2nd order and 4th Order using the function.
% MATLAB Tutorials. - www.TestingDocs.com
clear
close all
x = linspace(-2*pi, 2*pi, 100);
f = @(x) sin(x);
plot(x,f(x),'--rs','LineWidth',1.5,...
'MarkerEdgeColor','k',...
'MarkerFaceColor','g',...
'MarkerSize',9)
hold on;
grid on;
plot(x,sinTaylorApprox(x, 1),'--rs','LineWidth',1.5,...
'MarkerEdgeColor','c',...
'MarkerFaceColor','r',...
'MarkerSize',9)
plot(x,sinTaylorApprox(x, 2),'--rs','LineWidth',1.5,...
'MarkerEdgeColor','m',...
'MarkerFaceColor','b',...
'MarkerSize',9)
xlabel('x - axis');
ylabel('y - axis');
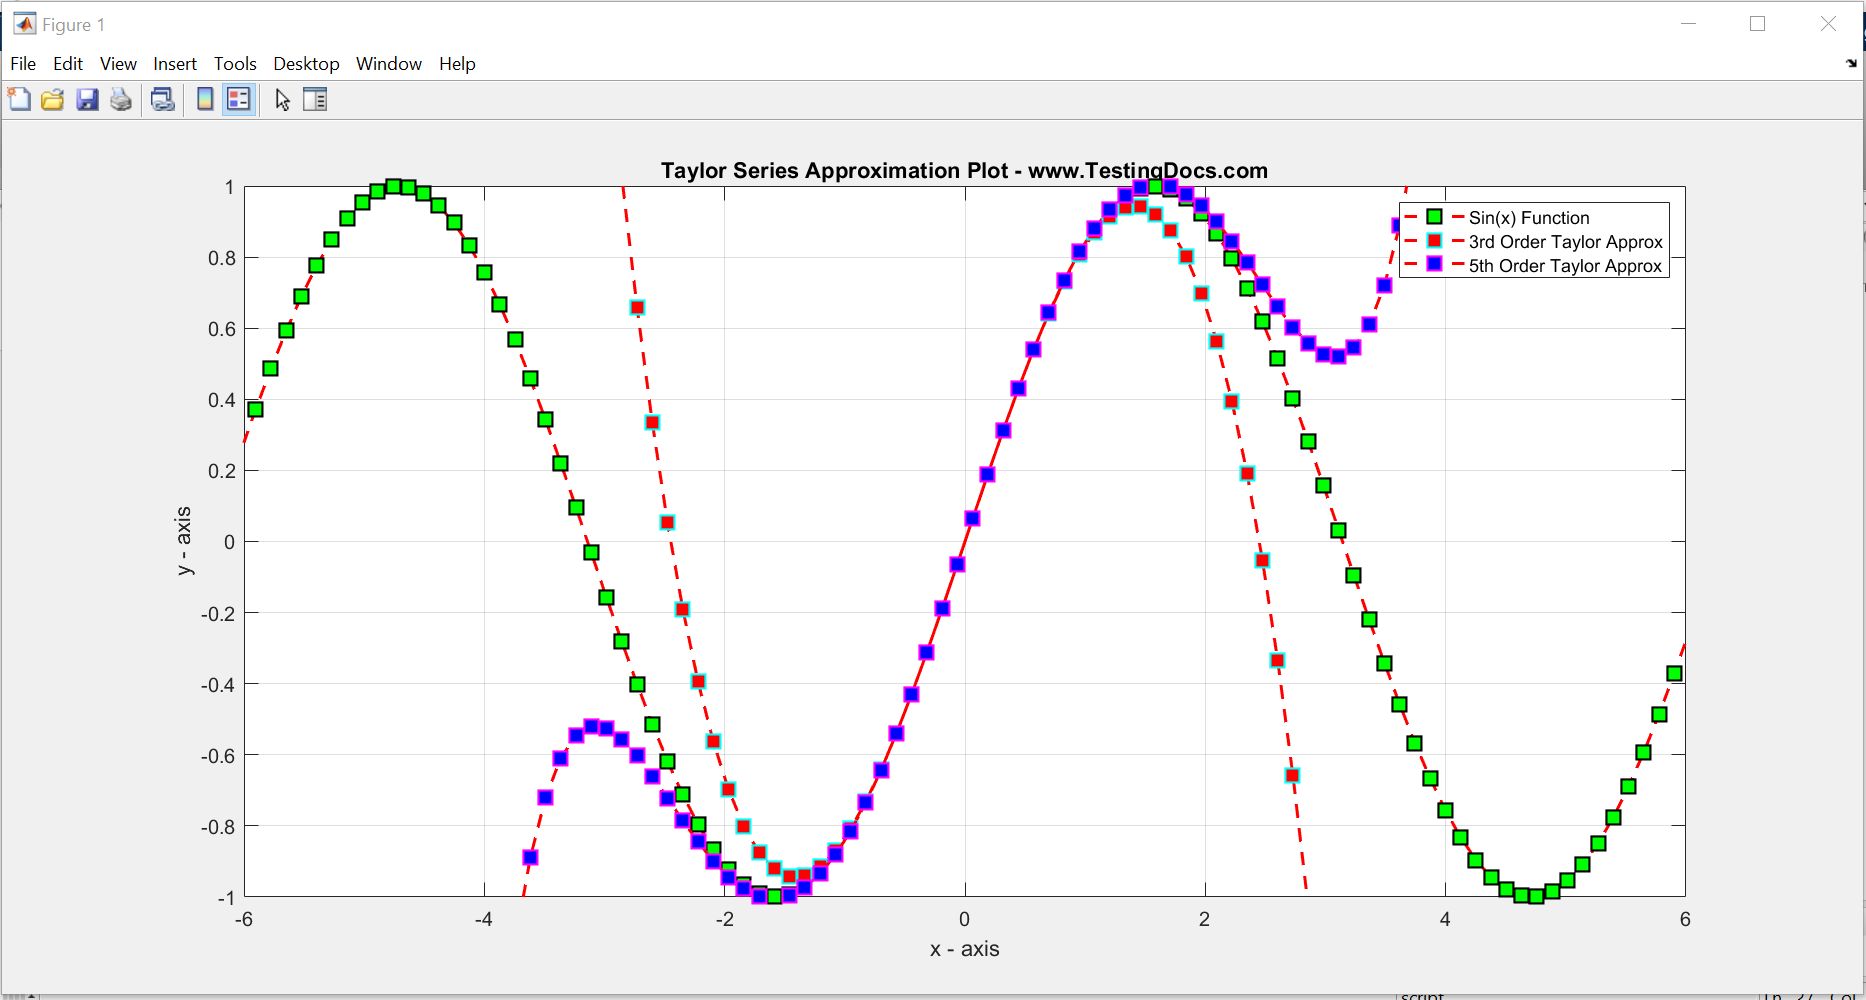
axis([-6 6 -1 1])
legend('Sin(x) Function', '3rd Order Taylor Approx','5th Order Taylor Approx');
title('Taylor Series Approximation Plot - www.TestingDocs.com');
Code screenshot
Approximations Graphs
That’s it.
—
MATLAB Tutorials on this website can be found here:
To try MATLAB Software or to learn more about MATLAB,
MATLAB official website:
- https://www.mathworks.com

