TradingView Strategy Tester
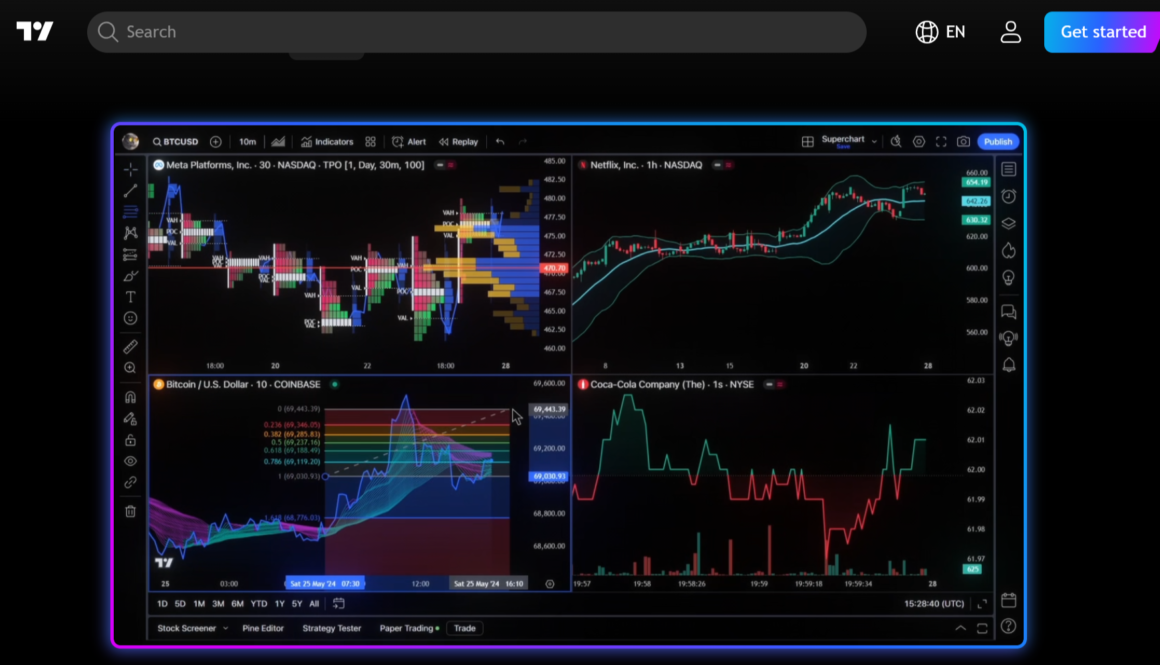
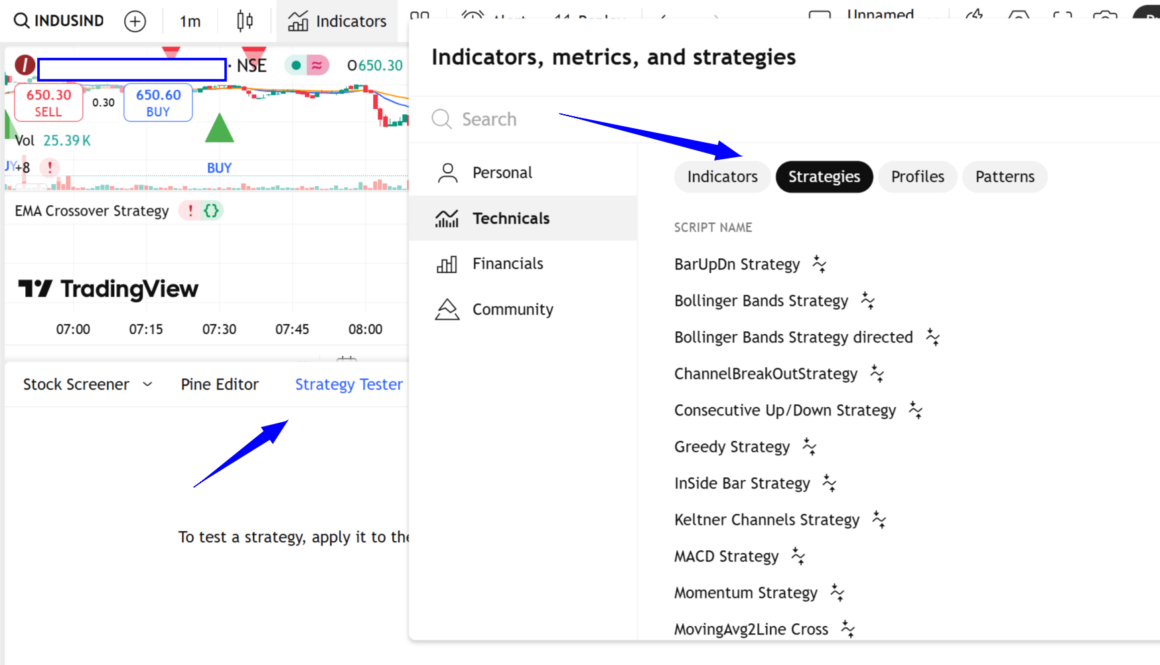
TradingView Strategy Tester TradingView Strategy Tester is a back testing tool that allows users to test trading strategies on historical data. It allows traders to analyze historical performance, optimize strategies, and refine trading rules using Pine Script. A built-in feature in TradingView that helps traders test their strategies on historical data. It shows performance metrics […]