Octave plot3 command
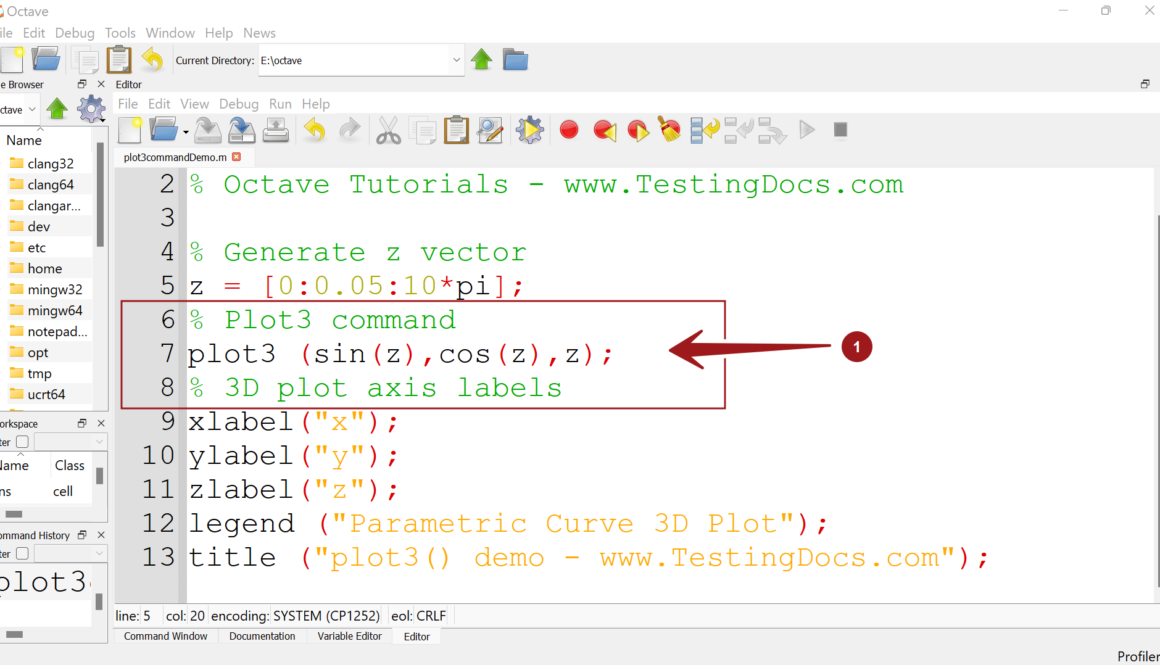
In this tutorial, we will learn about the Octave plot3 command. Plot3 is an in-built function that produces 3D plots in Octave. To generate a 2D plot, we can
Octave
In this tutorial, we will learn about the Octave plot3 command. Plot3 is an in-built function that produces 3D plots in Octave. To generate a 2D plot, we can
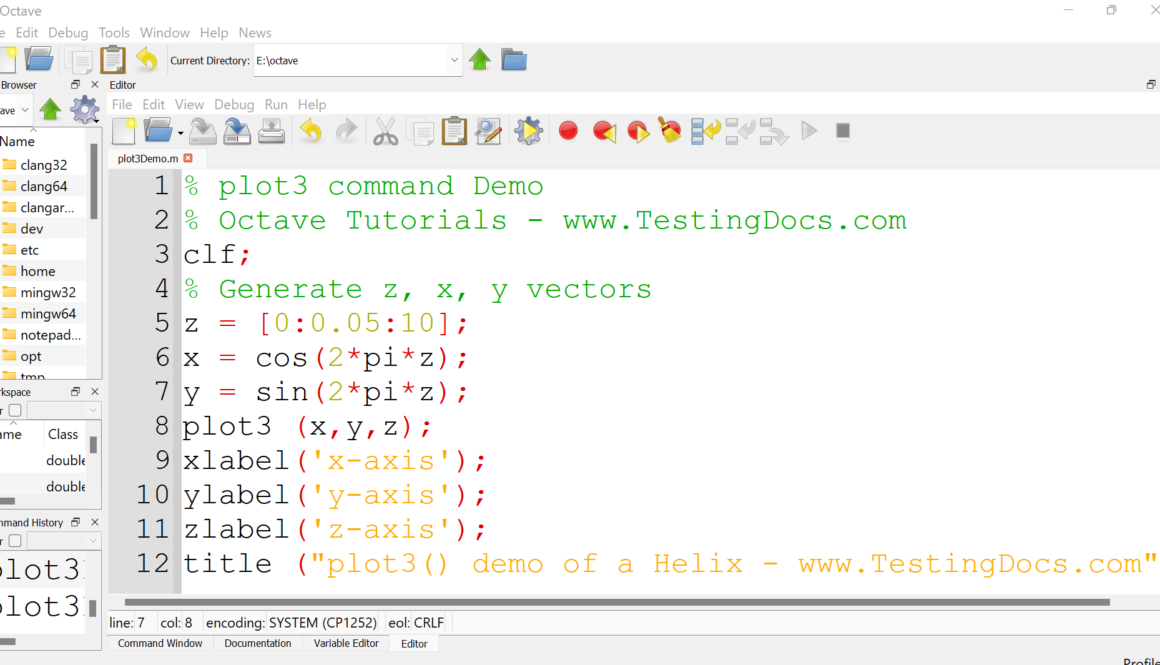
Three-dimensional plots using Octave : In this tutorial, we will learn how to produce a three-dimensional plot using Octave, which can plot data
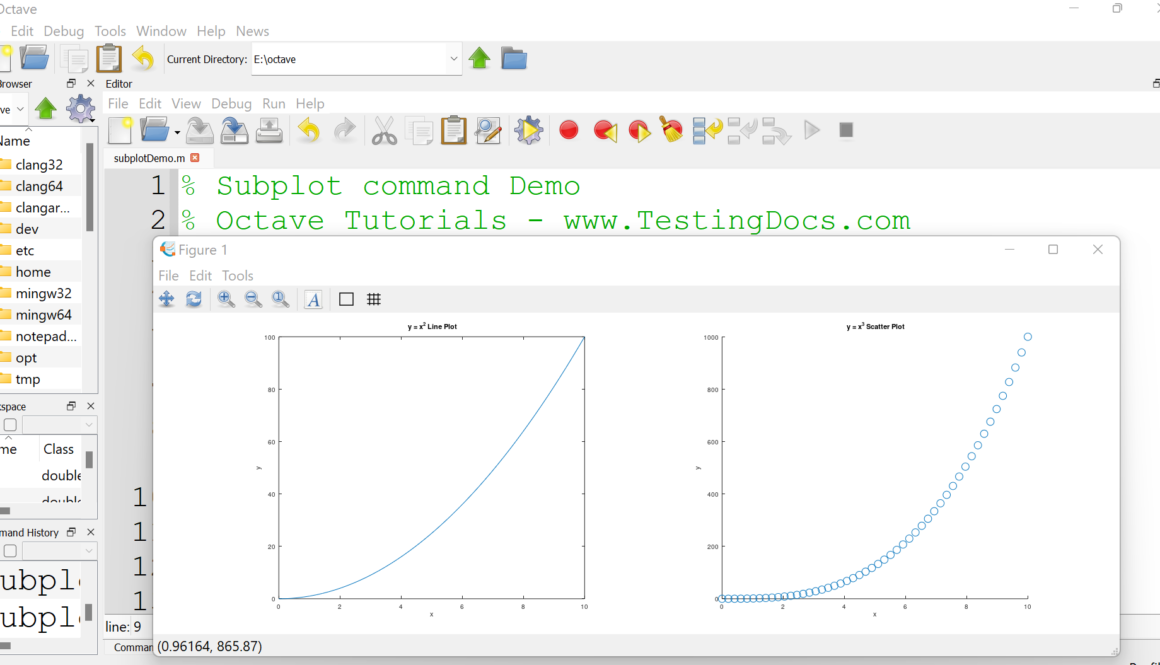
In this tutorial, we will learn about the Octave subplot command, which creates a grid of plots on a single Figure window.
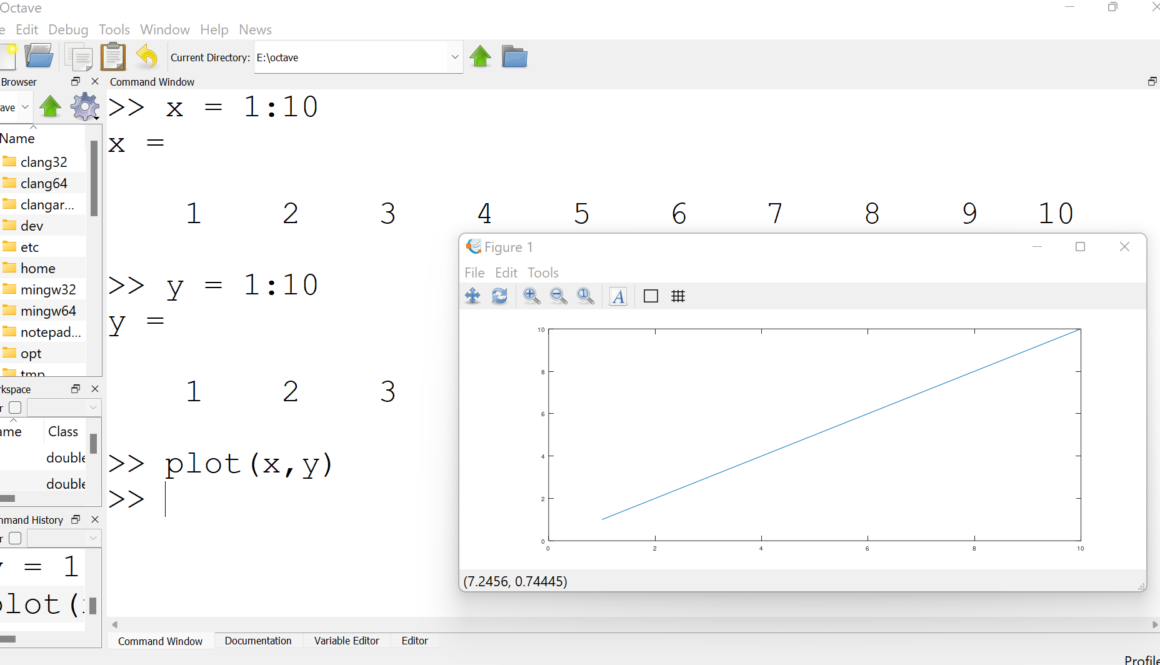
In this tutorial, we will learn how to produce a two-dimensional plot using Octave. Octave has the ability to plot and visualize the data in many different ways
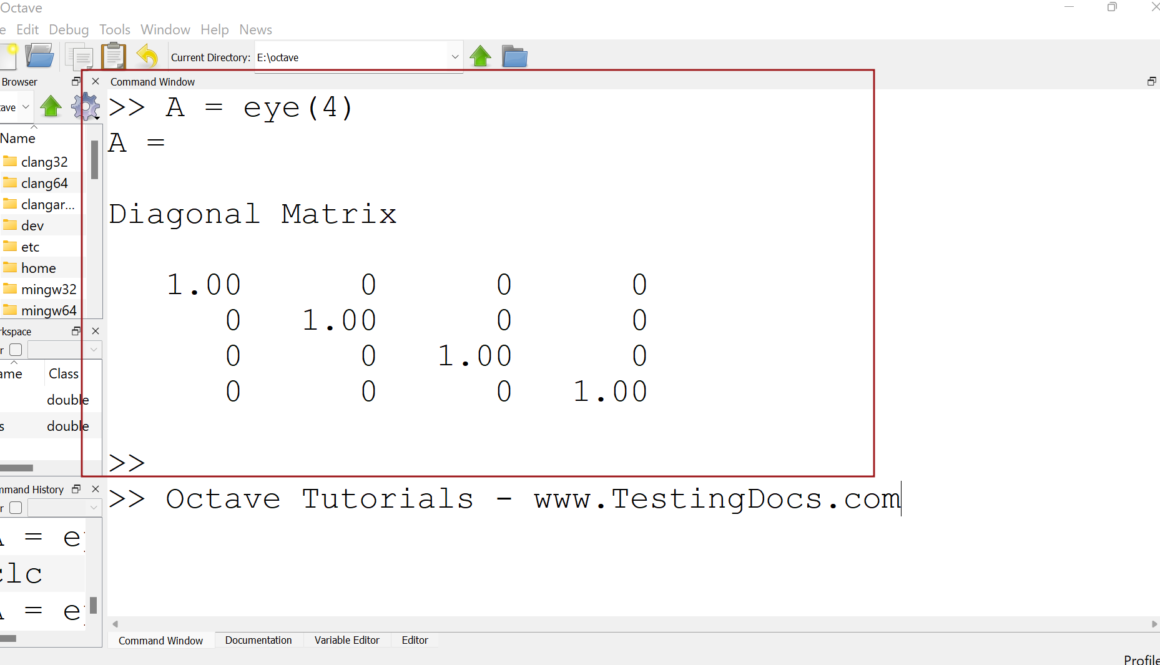
In this tutorial, we will learn about the basic Octave matrix functions with examples. Some of the functions to create a matrix are as follows:
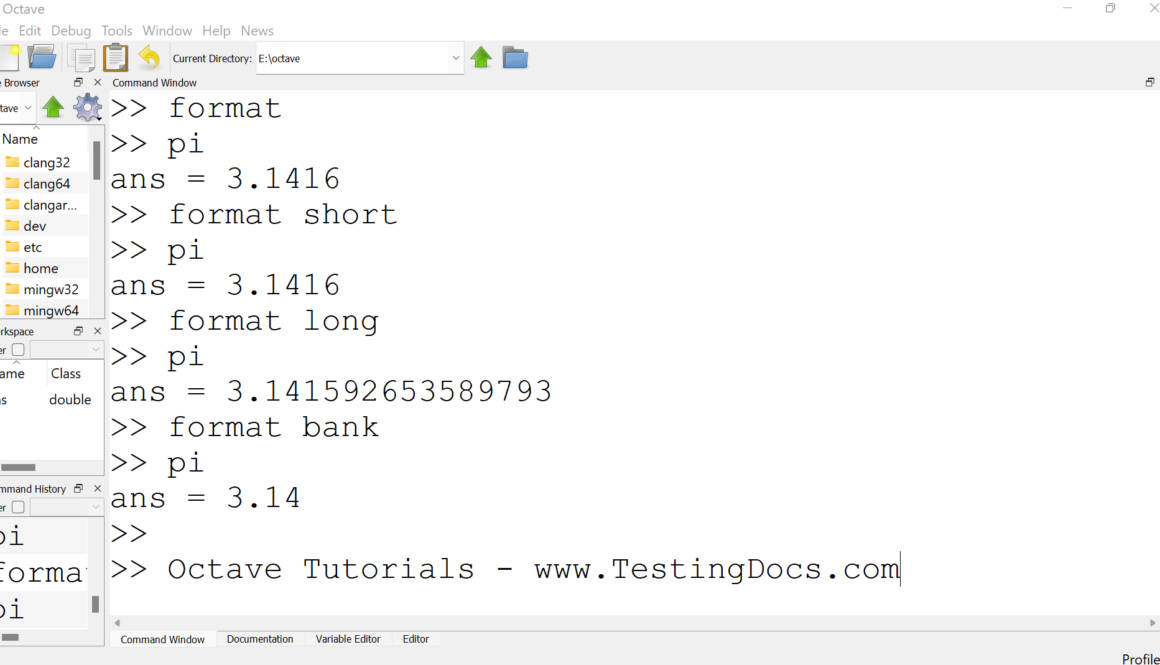
Octave format command : In this tutorial, we will learn about the Octave format command. The format is a built-in Octave function.