TestingDocs.com
Software Testing website
  • Automation
    • Selenium
    • JBehave Framework
  • Tutorials
    • MySQL Tutorials
    • Testlink
    • Maven
    • Git
  • IDEs
    • IntelliJ IDEA
    • Eclipse
  • Flowcharts
    • Flowgorithm
    • Raptor
  • About

Octave

Octave subplot command

Overview

In this tutorial, we will learn about the Octave subplot command.

subplot command

The Octave subplot command is used to create a grid of plots on a single Figure window.

Syntax

subplot (rows, cols, index)

Set up a plot grid with rows x cols subwindows. We can specify the current slot for plotting by index.

Example

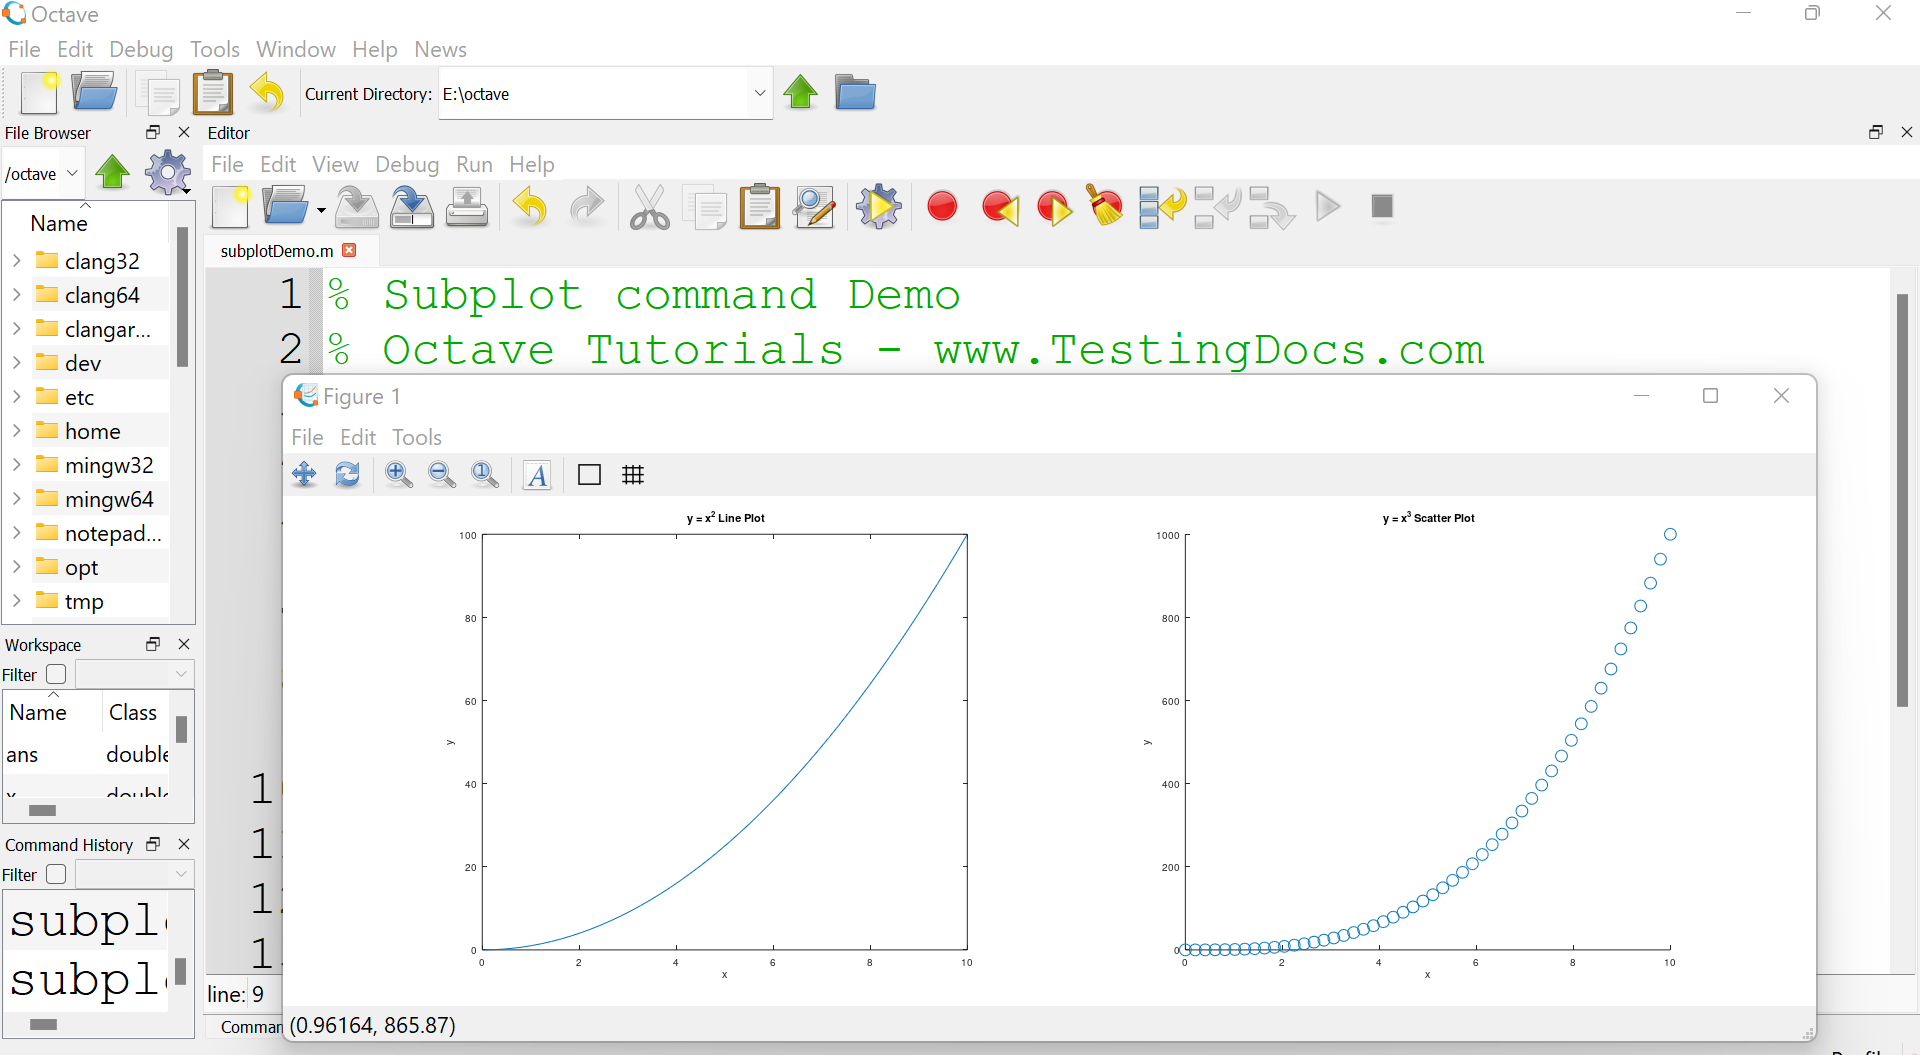
In this example, we will plot two plots in the same Figure using the subplot command.

The first plot is for the function:

y = x^2;

The second plot is for the function:

y= x^3;

Octave Script

% Subplot command Demo
% Octave Tutorials – www.TestingDocs.com
clf;

x = linspace(0,10,50);
y = x.^2;
subplot(1,2,1);
plot(x, y);
xlabel(“x”);
ylabel(“y”);
title(” y = x^2 Line Plot”);

y = x.^3;
subplot(1,2,2);
scatter(x, y);
xlabel(“x”);
ylabel(“y”);
title(” y = x^3 Scatter Plot”);


Octave subplot command

—

Octave Tutorials

Octave Tutorial on this website can be found at:
https://www.testingdocs.com/octave-tutorial/

More information on Octave can be found on the official website:
https://www.gnu.org/software/octave/index

Related Posts

Octave Package List

Octave /

Install Octave Packages on Linux

Octave /

Octave User defined Function Example

octave command line linux

Octave /

Octave Command line on Ubuntu

Hello World in Octave

Octave /

Hello World in Octave

Octave /

Octave plot example of function y=x^2

‹ Two-dimensional plot using Octave› Three-dimensional plots using Octave

Recent Posts

  • Install RAPTOR Avalonia on CentOS
  • Download RAPTOR Avalonia Edition on Windows
  • npm doctor command
  • Print Triangle Pattern Flowchart
  • RAPTOR Editions
  • Flowgorithm Conditional Breakpoint Statement
  • Flowgorithm Read Numbers from File Example
  • Search Text File Flowchart Example
  • Flowgorithm Turtle Graphics Symbols
  • Draw Circle using Flowgorithm Turtle

Back to Top

Links

  • Contact
  • Privacy Policy
  • Cookie Policy

www.TestingDocs.com

Go to mobile version