How to monitor OpenAI API Logs
How to monitor OpenAI API Logs
In this tutorial, you will learn about OpenAI API logs. OpenAI API logs allow developers to monitor and troubleshoot API calls and detailed information for communication with the OpenAI servers.
The logs record details about API requests and responses, providing valuable insights into usage patterns, performance issues, and potential errors or further analysis.
Health of APIs
API logs are essential tools for developers to monitor and analyze the activity and health of their APIs.
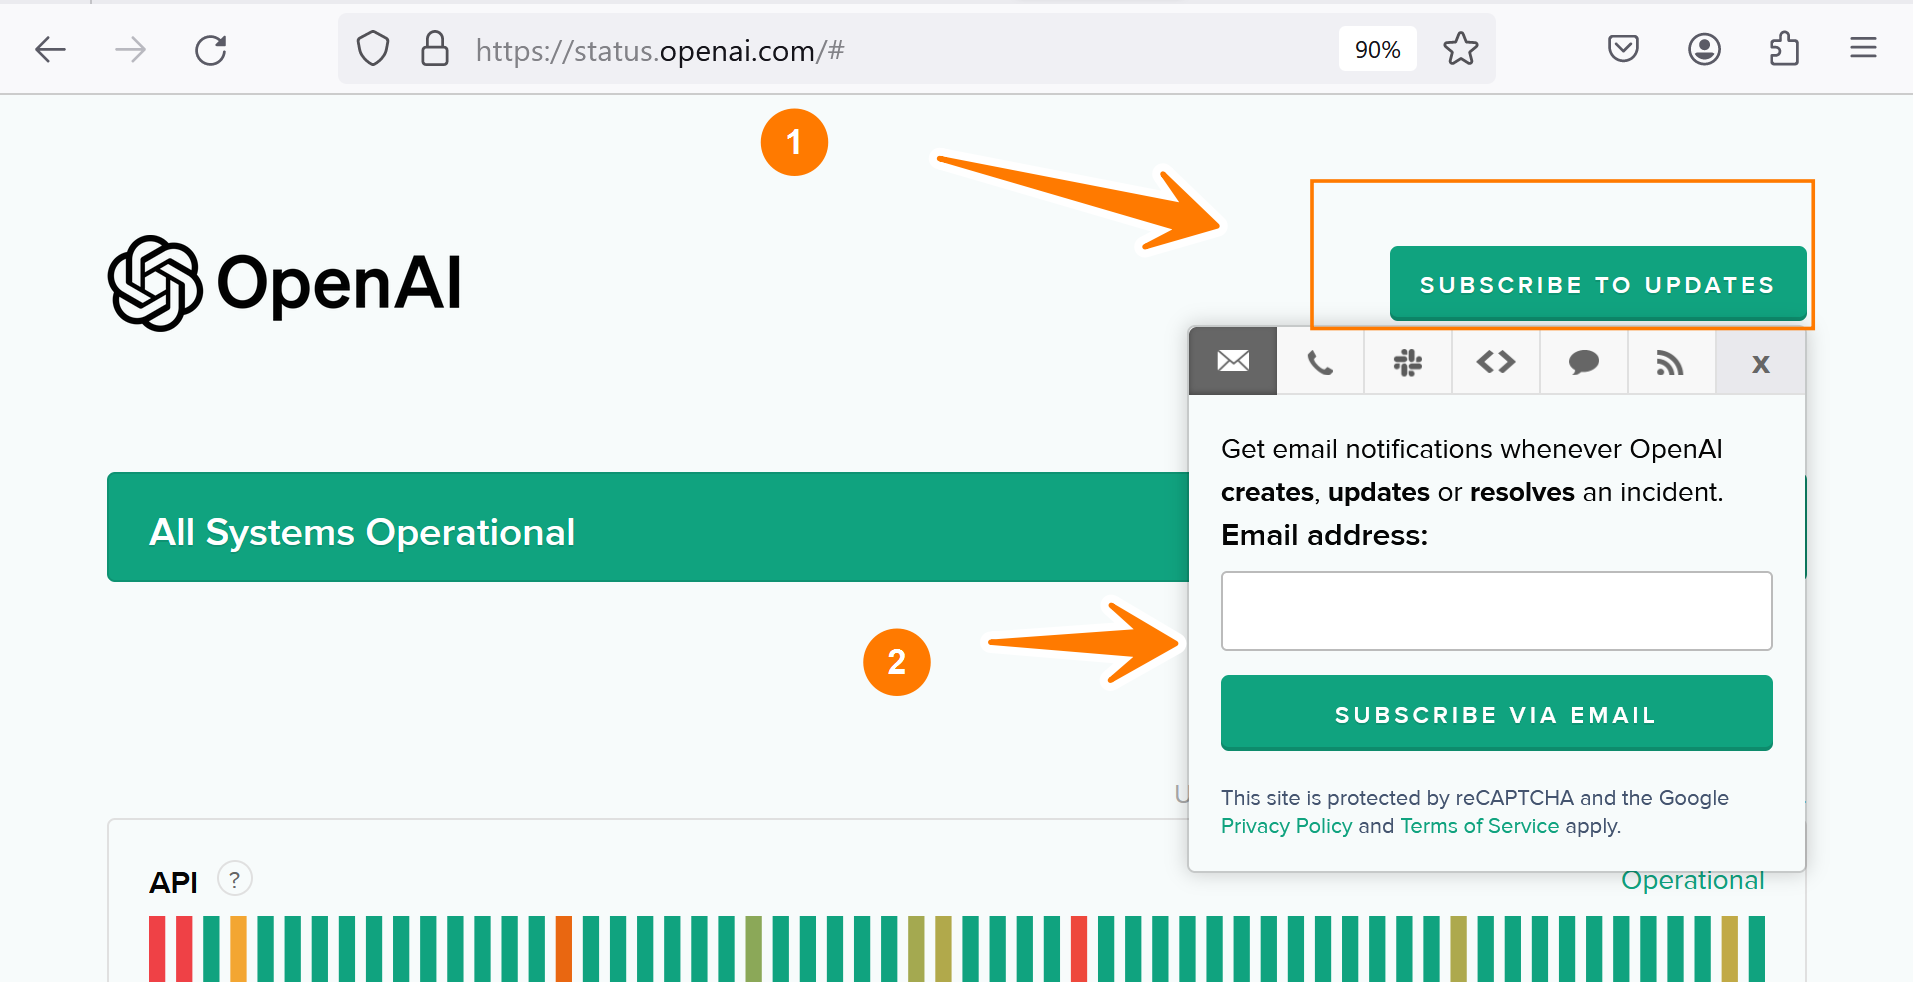
You can view the current status of the API health on the following page:
- https://status.openai.com/
The green blocks or patches generally indicate that the APIs are operational and are successfully working.
The red and orange patches indicate downtime or disruptions.
Subscribe for Updates
To receive API health updates and notifications, click the SUBSCRIBE TO UPDATES button. The page supports multiple subscription options and platforms.
- Email address
- Phone Number
- Slack
- Webhook notifications
- RSS Feed
To view historical updates and incident reports, click the link: view historical uptime.
The uptime of the services at:
- https://status.openai.com/uptime
API Logs Dashboard
We can view the logs for Playground API calls by clicking on the Logs button. The general steps to view the API logs in the Playground are as follows:
- Open OpenAI Playground
- Interact with an AI model
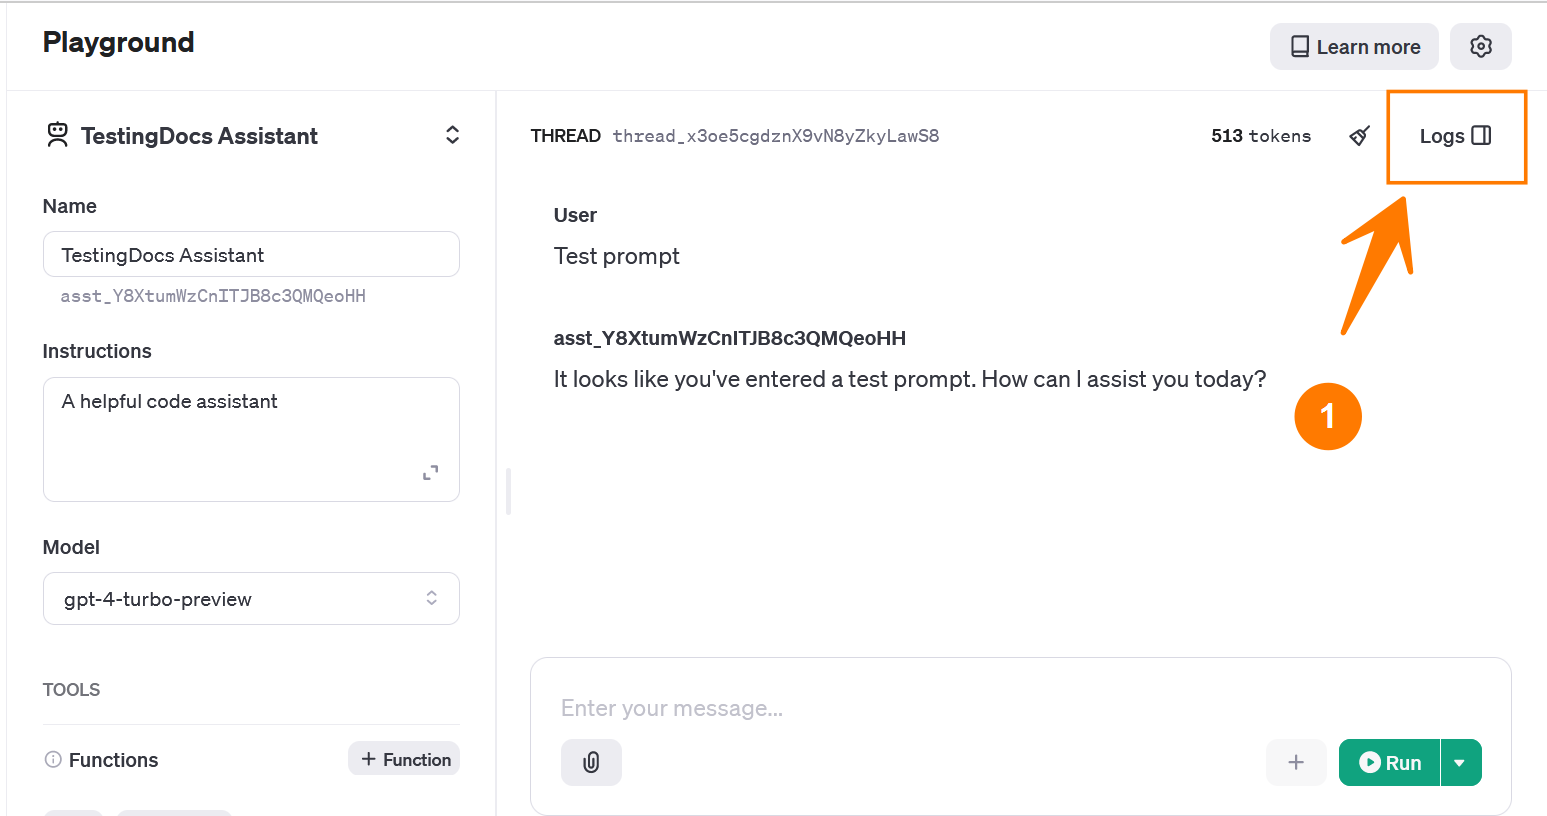
This will open the logs in a separate pane on the right side, along with the API calls issued during the playground interaction with the models.
That’s it. In the next part, we will learn how to analyze API logs at the server end to troubleshoot APIs using tools like Splunk, Nagios, etc.


