Octave plot3 command
Octave plot3 command
In this tutorial, we will learn about the Octave plot3 command. Plot3 is an in-built function that produces 3D plots in Octave. To generate a 2D plot, we can use the plot command. To know more about the plot command:
Syntax
The simplest function call is:
>> plot3(x,y,z);
where x, y, and z can be scalars, vectors, and matrices of the same length.
There are many different combinations of arguments to this command. To know we can use the help command.
>> help plot3
If the arguments are scalars the arguments are taken to be the vertices of the point to be plotted in three dimensions. If the arguments are vectors a continuous line plot would be generated in three dimensions.
The plot3 command will plot the (x,y,z) coordinates with the default blue line.
Example
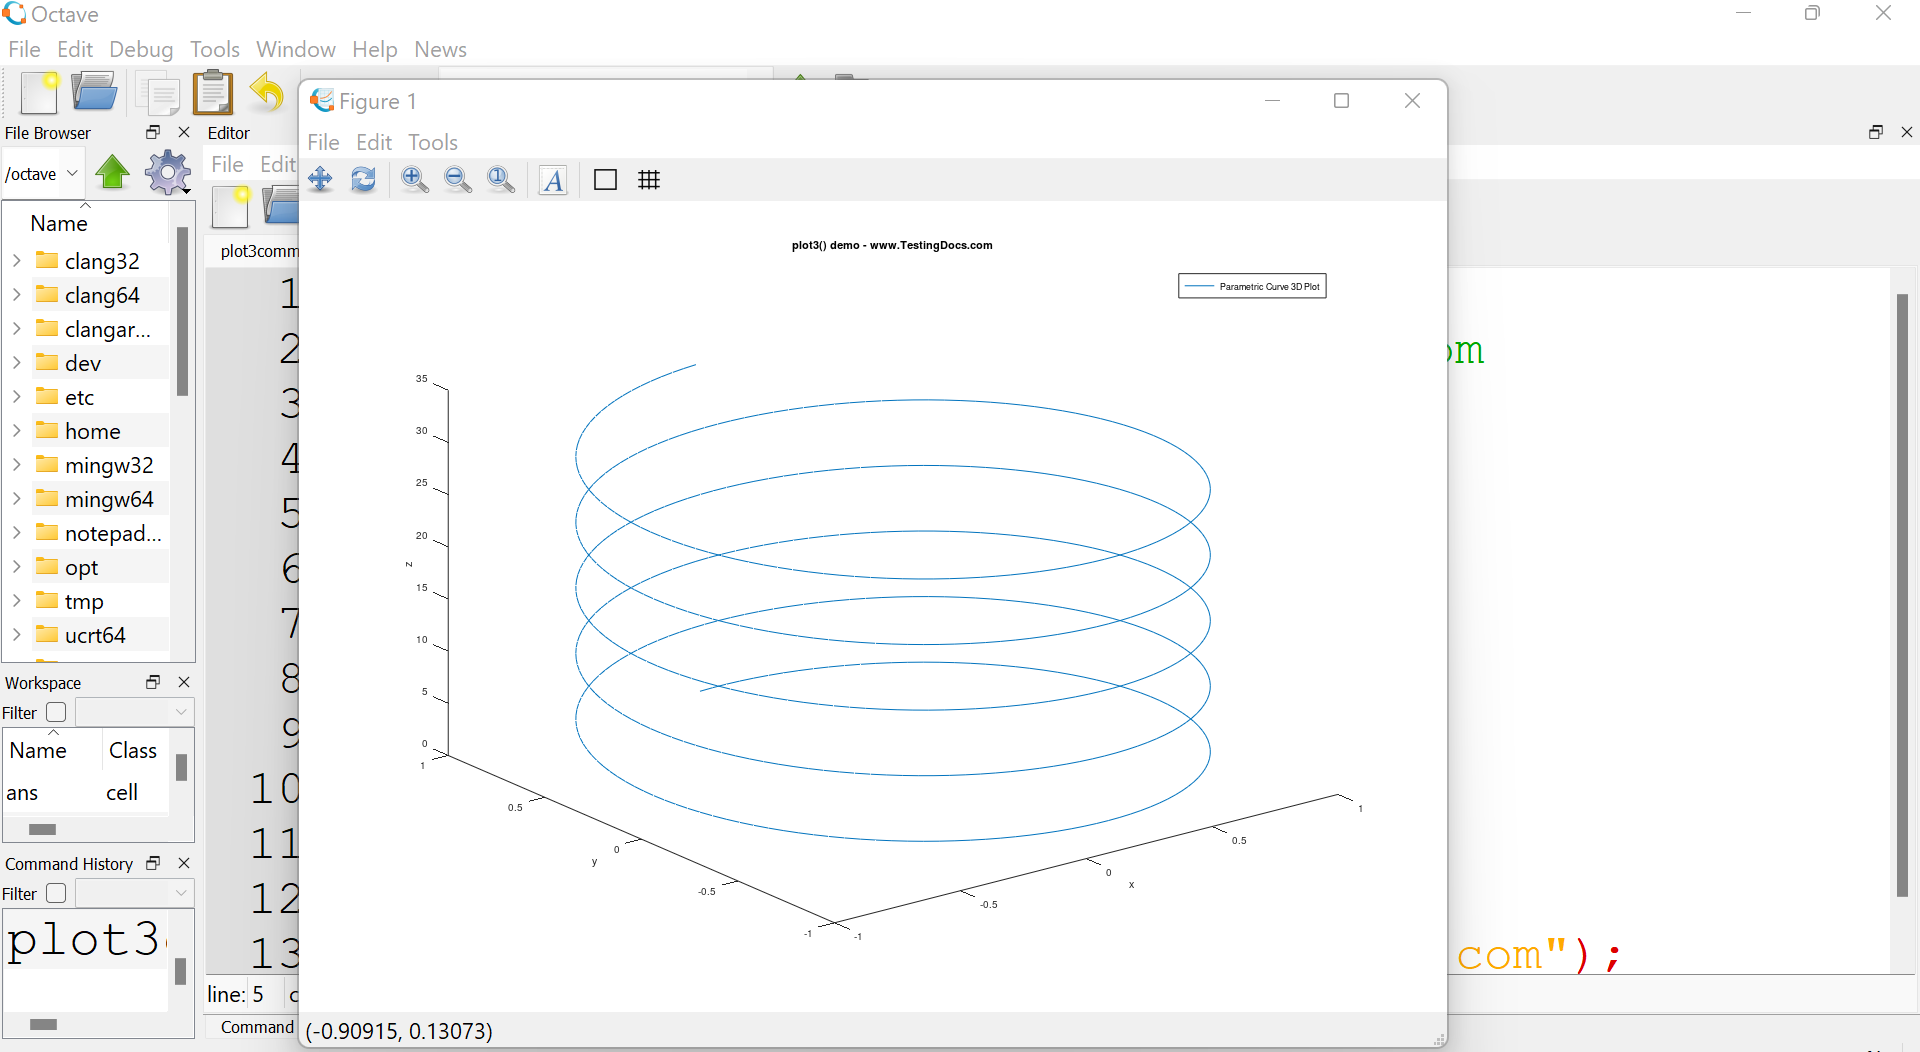
Let’s demonstrate the usage of the command with a simple three-dimensional plot of the Helix curve. A helix is a curve that resembles a spiral staircase.
Octave Script
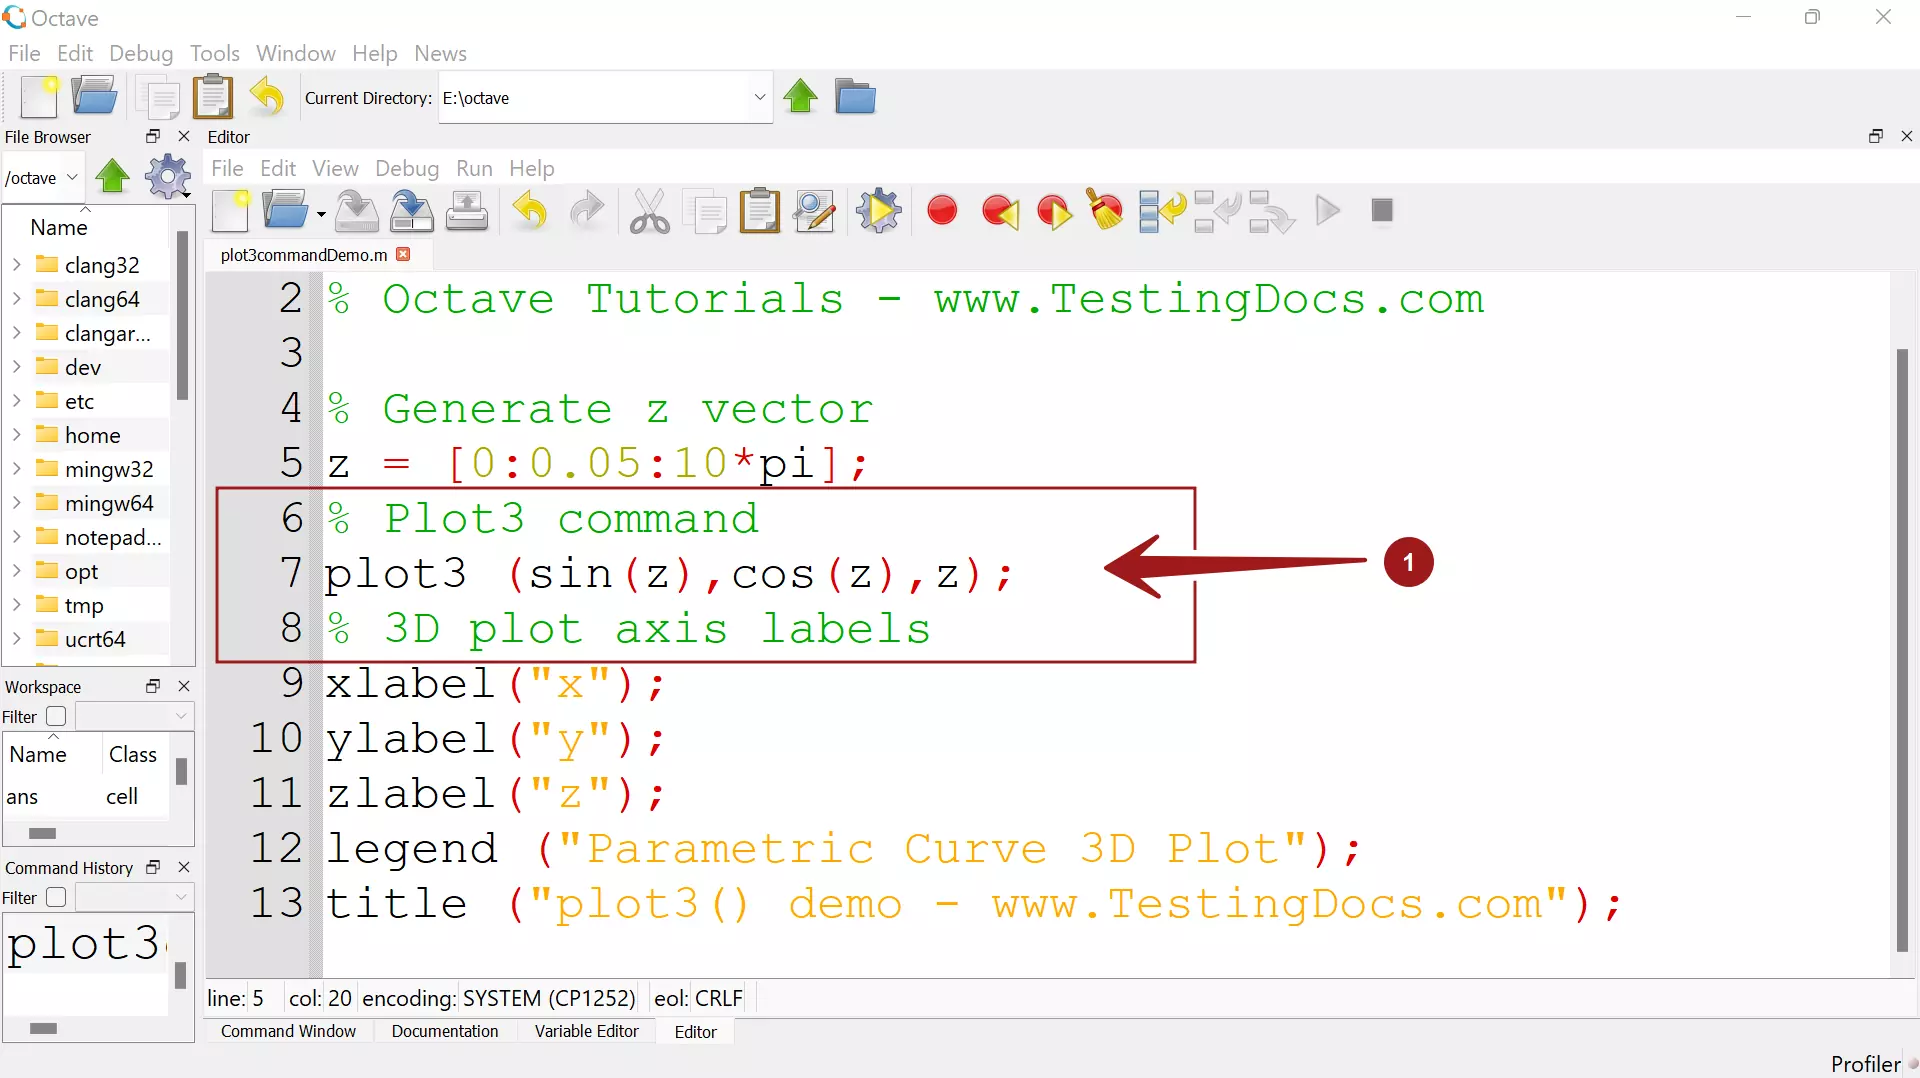
% Octave plot3 3D plot Demo
% Octave Tutorials – www.TestingDocs.com
clear all;
clf;
% Generate z vector
z = [0:0.05:10*pi];
% Plot3 command
plot3 (sin(z),cos(z),z);
% 3D plot axis labels
xlabel(“x”);
ylabel(“y”);
zlabel(“z”);
legend (“Parametric Curve 3D Plot”);
title (“plot3() demo – www.TestingDocs.com”);
Screenshot
3D plot
—
Octave Tutorials
Octave Tutorial on this website can be found at:
https://www.testingdocs.com/octave-tutorial/

