TestingDocs.com
Software Testing website
  • Automation
    • Selenium
    • JBehave Framework
  • Tutorials
    • MySQL Tutorials
    • Testlink
    • Maven
    • Git
  • IDEs
    • IntelliJ IDEA
    • Eclipse
  • Flowcharts
    • Flowgorithm
    • Raptor
  • About

Octave

Octave 2D pie Chart

Overview

In this tutorial, we will learn about the Octave 2D pie chart command. To plot a 2-D pie chart we can use the pie command.

Syntax

>> pie(x)

>> pie(x,[options])

Script

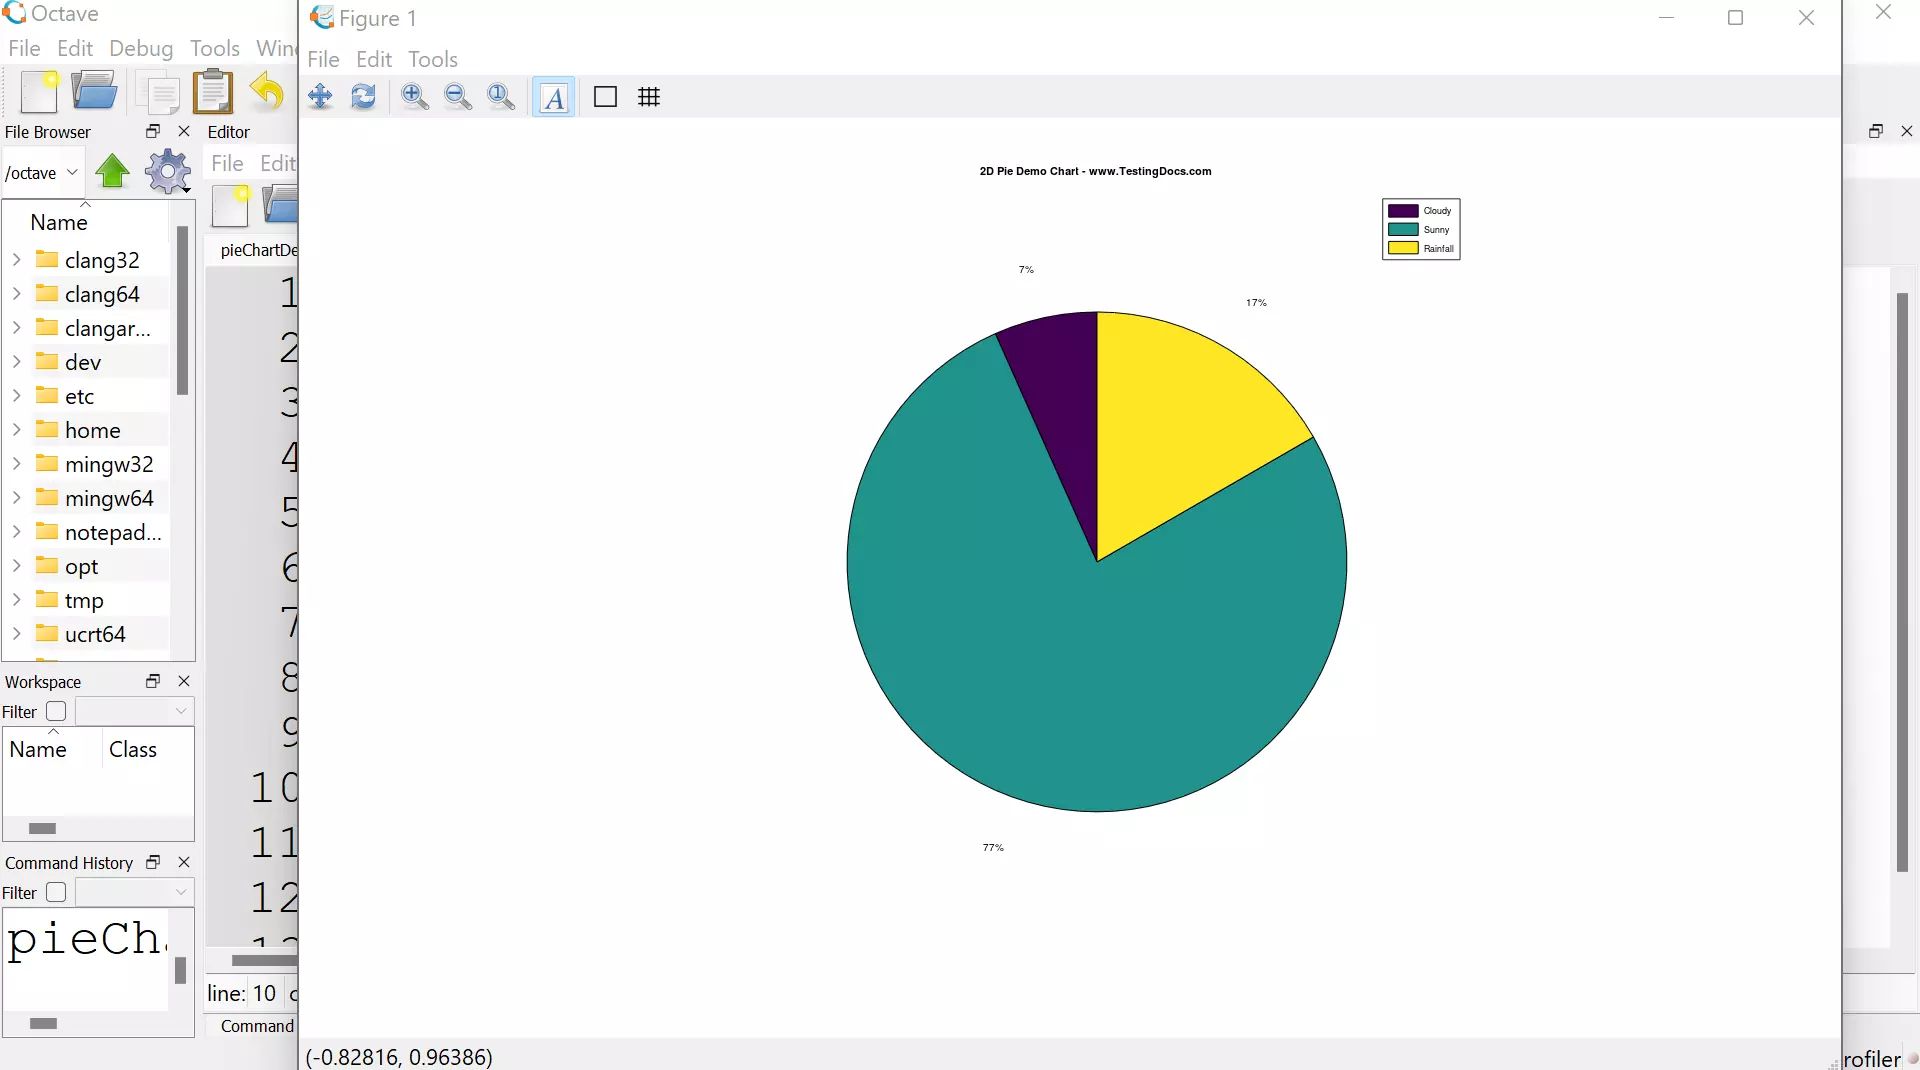
In this example, we will generate a sample 2D pie chart for sample rainfall data for a month.

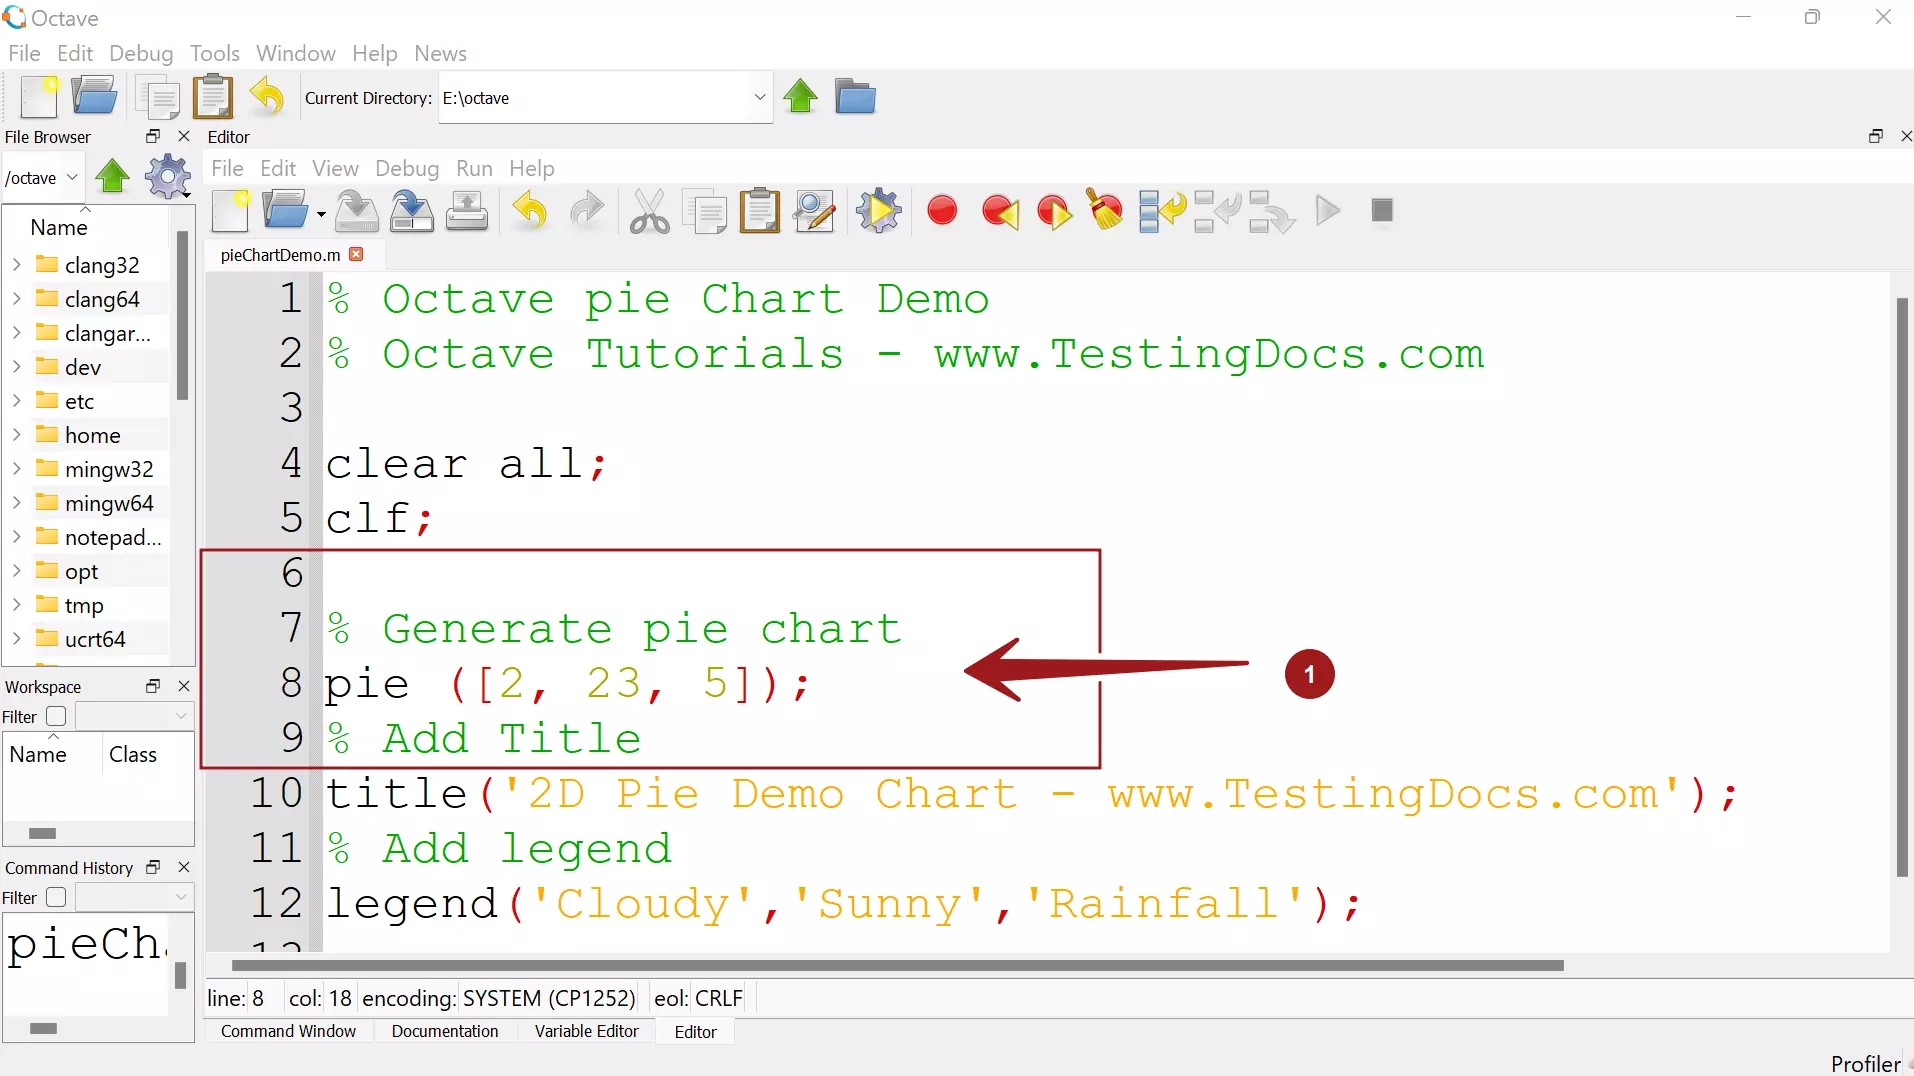
% Octave pie Chart Demo
% Octave Tutorials – www.TestingDocs.com

clear all;
clf;

% Generate pie chart
pie ([2, 23, 5]);
% Add Title
title(‘2D Pie Demo Chart – www.TestingDocs.com’);
% Add legend
legend(‘Cloudy’,’Sunny’,’Rainfall’);

Octave 2D pie chart

2D pie chart

2D pie chart Output

—

Octave Tutorials

Octave Tutorial on this website can be found at:
https://www.testingdocs.com/octave-tutorial/

More information on Octave can be found on the official website:
https://www.gnu.org/software/octave/index


Related Posts

Octave Package List

Octave /

Install Octave Packages on Linux

Octave /

Octave User defined Function Example

octave command line linux

Octave /

Octave Command line on Ubuntu

Hello World in Octave

Octave /

Hello World in Octave

Octave /

Octave plot example of function y=x^2

‹ Octave plot3 command› Octave who command

Recent Posts

  • MS Access Data Types
  • Install RAPTOR Avalonia on CentOS
  • Download RAPTOR Avalonia Edition on Windows
  • npm doctor command
  • Build & Run CLion Project
  • Create New CLion C Project on Windows
  • Configure CLion Toolchains on Windows
  • Launch CLion IDE on Windows
  • Activate CLion IDE
  • CLion IDE for C/C++ Development

Back to Top

Links

  • Contact
  • Privacy Policy
  • Cookie Policy

www.TestingDocs.com

Go to mobile version