MATLAB Pie Chart
MATLAB Pie Chart
In this tutorial, we will learn how to plot a Pie chart using MATLAB. Here is a sample script using the pie() command. pie(V) 2D plots the pie chart using the data in V. The 3D version of the command is pie3.
The legend command adds a legend to the plotted pie chart. We can specify the chart’s labels using the x-label and y-label commands.
Sample Script
A sample script to plot the Pie chart. The data used is student subject marks in each of the subjects. The legend labels for the plot are the subjects.
% Sample Matlab Script for Pie Chart
% www.TestingDocs.com - MATLAB Tutorials
% Clean the Matlab Environment
clc
clear
close all

% Sample Student marks data vector for the Pie chart
pieData = [35 75 97 39 45 66];

% Generate the Pie Chart
pie(pieData);
% Title to the Pie Chart
title('Pie Chart Demo - www.TestingDocs.com');
% Legend to the Pie Chart
subjects = {'English','Maths','Physics','Chemistry','Biology','History'};
legend(subjects,'Location','southoutside','Orientation','horizontal')
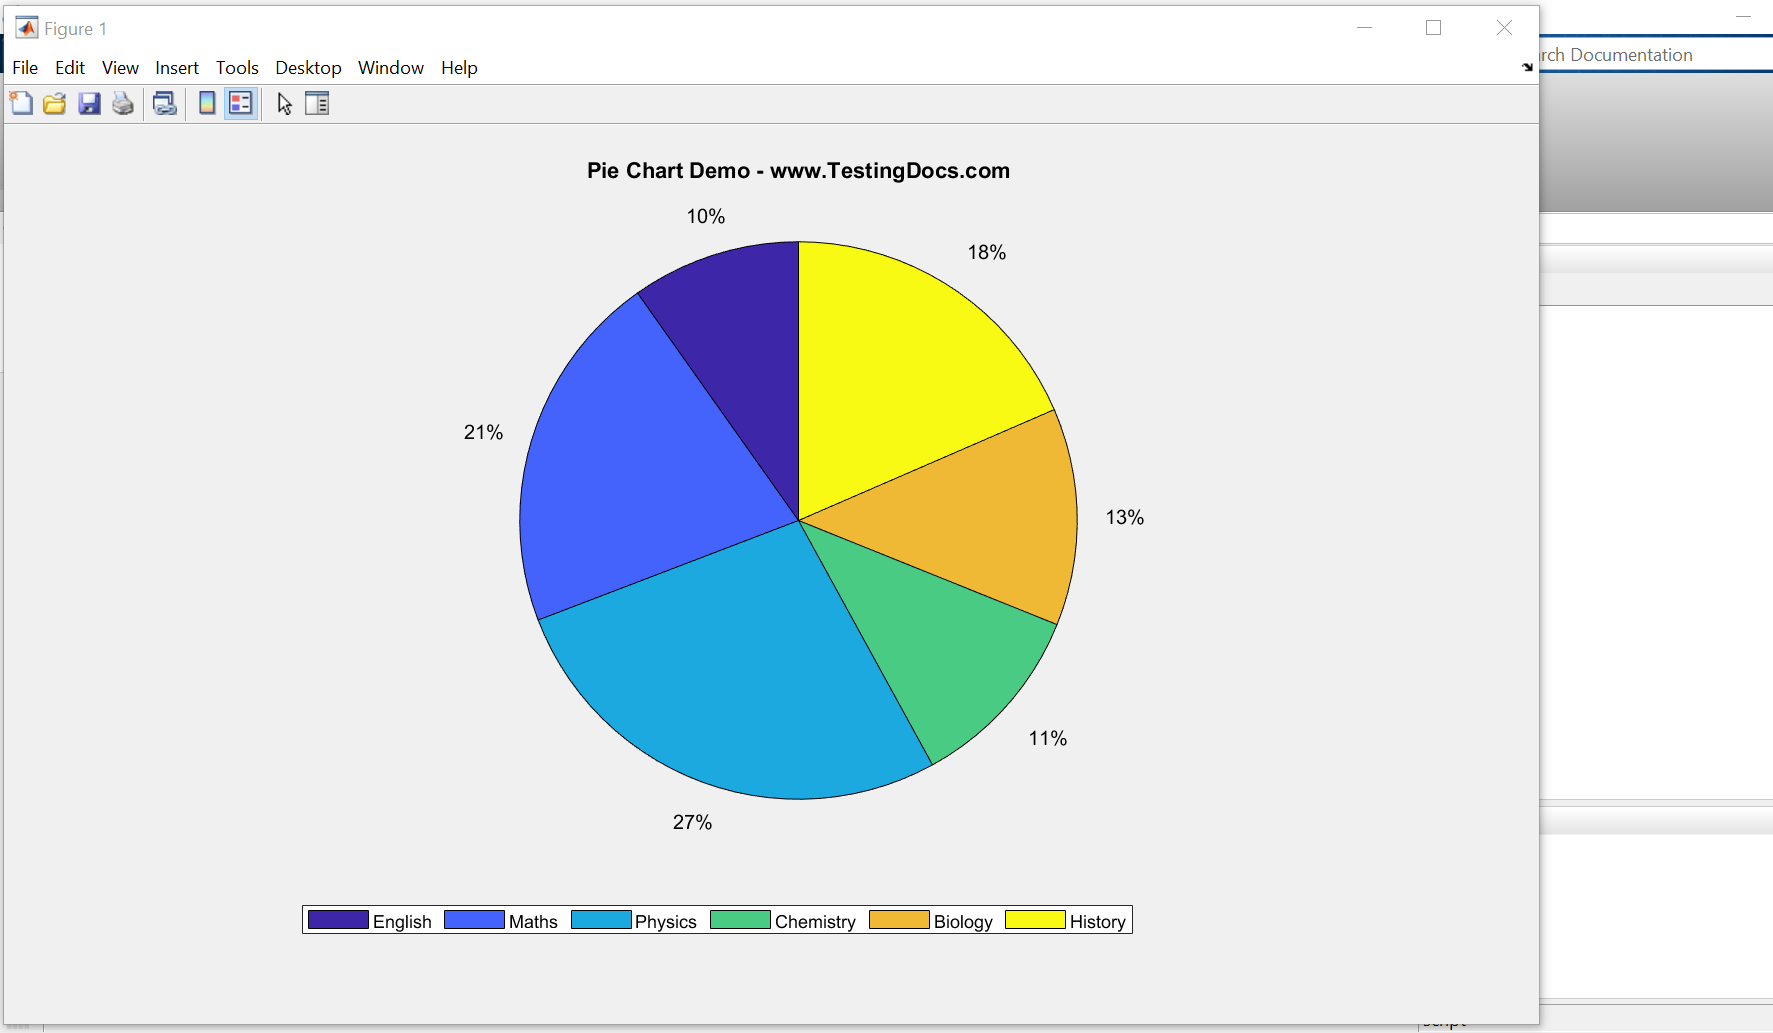
Screenshot
Run the script to view the pie chart.
Click on the Editor >> Run green run button from the toolstrip.
MATLAB Tutorials on this website can be found here:
To try MATLAB Software or to learn more about MATLAB,
MATLAB official website:
- https://www.mathworks.com

