MATLAB 2D Plot command
MATLAB 2D Plot command
The basic plot function in MATLAB is the plot linear plot command. The simple plot command takes two vectors X and Y and plots them in 2D space.
plot(X,Y)
The plot command can plot in color and with different symbols.
plot command
Let’s issue the plot command from the Command Window prompt. Create two vectors for the plot command.
>> x = linspace(-pi,pi,100);
>> y = tan(sin(x)) - sin(tan(x));
>> plot(x,y)
Screenshot
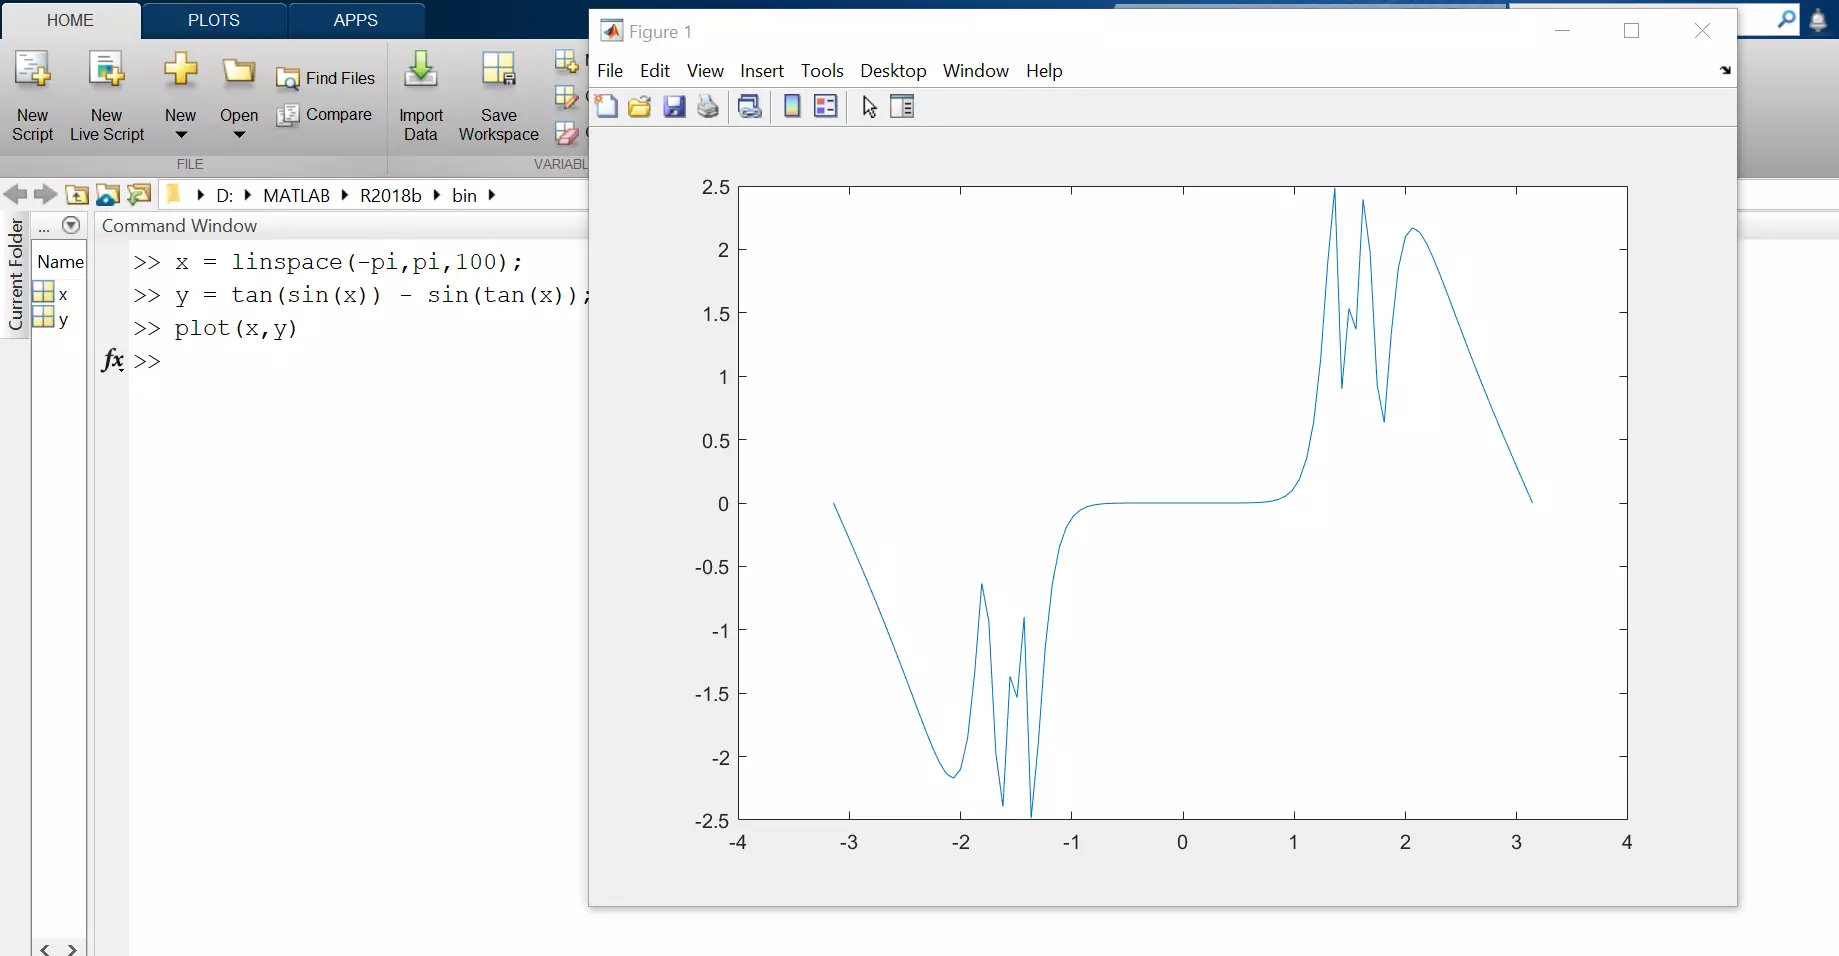
linspace creates a linearly spaced vector. For example,
linspace(low,high,N) created N points between low and high.
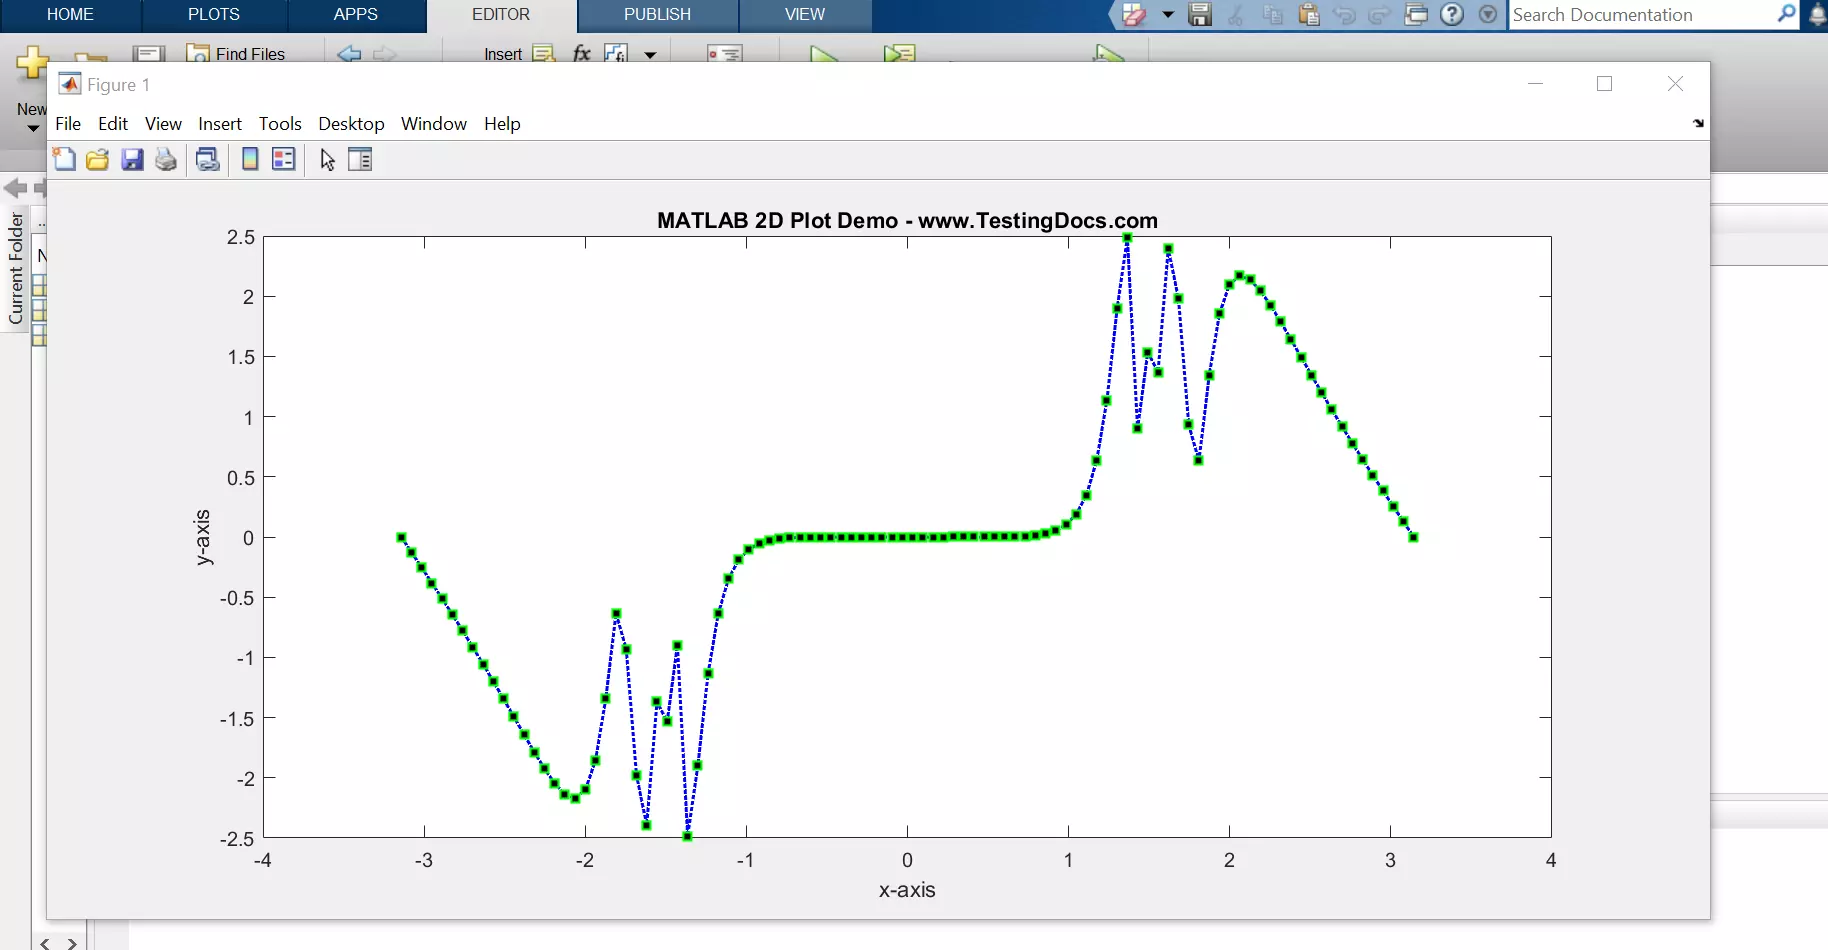
Sample Script
Lets write a simple script to add title , labels to the graph.
% Sample MATLAB Script to plot a function
% MATLAB Tutorials - www.TestingDocs.com

x = linspace(-pi,pi,100); % 100 linearly spaced points within [-pi,pi]
y = tan(sin(x)) - sin(tan(x)); % Plot function

plot(x,y);
xlabel('x-axis');
ylabel('y-axis');
title('MATLAB 2D Plot Demo - www.TestingDocs.com');
Run the script.
Notice that the graph now has a title and x,y axis labels.

Adding markers to the plot command.
plot(x,y,’:bs’,’LineWidth’,1.5,…
‘MarkerEdgeColor’,’g’,…
‘MarkerFaceColor’,’k’,…
‘MarkerSize’,6)
MATLAB Tutorials on this website can be found here:
https://www.testingdocs.com/matlab-tutorial/
To try MATLAB Software or to learn more about MATLAB,
MATLAB official website:

