MATLAB Subplots Example
MATLAB Subplots Example
In this tutorial, you will learn about MATLAB Subplot. A subplot is a function used to display multiple plots in a single figure window. It allows you to divide the figure into a grid of subplots and place a different plot in each section.
Subplots allow us to plot multiple charts on the same figure in a grid. The axes are created in tiled positions. We can create subplots using the subplot command.
Syntax
The general syntax is as follows:
subplot(m,n,k)
divides the figure into m x n grid.
-
m– number of rows in the grid -
n– number of columns in the grid -
k– kth position of the subplot (numbered left to right, top to bottom)
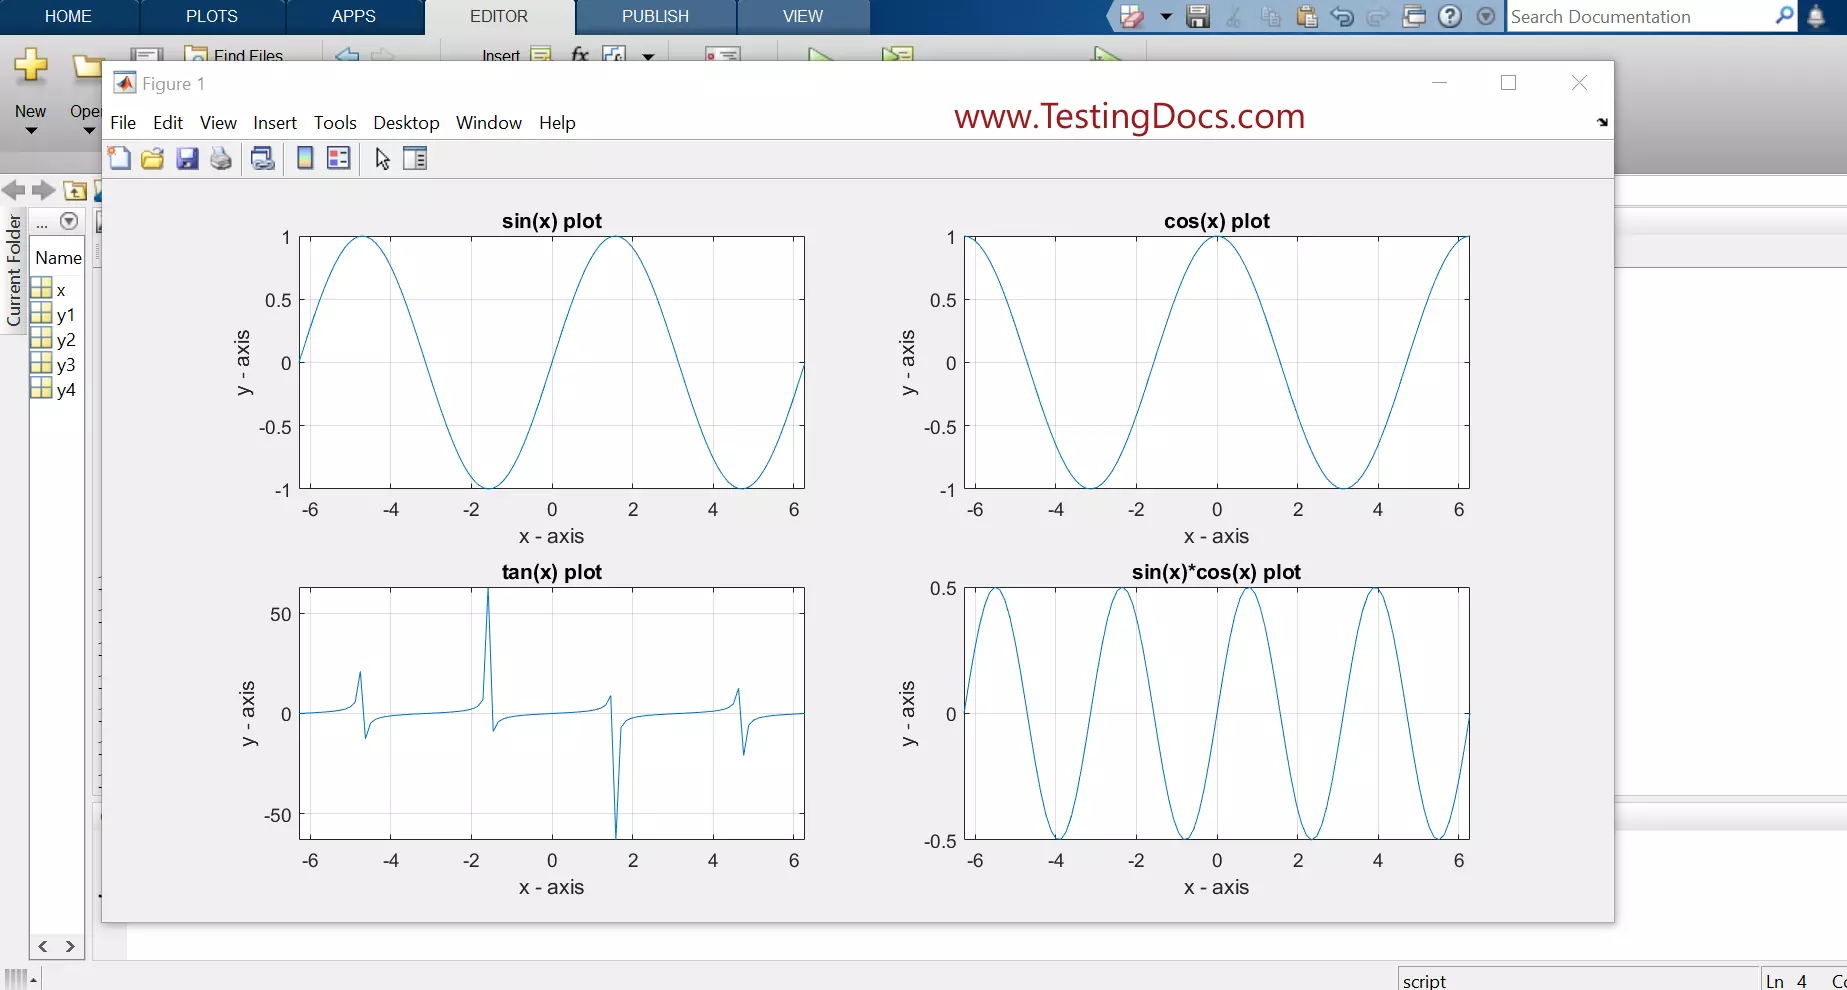
Let’s create subplots for four sample trigonometric functions like:
- sin(x)
- cos(x)
- tan(x)
- sin(x)*cos(x)
We will create the four subplots in a 2×2 grid.
MATLAB Script
% Subplots Example - www.TestingDocs.com
% Creates 2x2 subplots

% Create x and y vectors
x = linspace(-2*pi,2*pi,100);
y1 = sin(x);
y2 = cos(x);
y3 = tan(x);
y4 = sin(x).*cos(x);

% Create 4 Subplots
subplot(2,2,1);
plot(x,y1);
xlabel('x - axis')
ylabel('y - axis')
title('sin(x) plot');
grid on;

subplot(2,2,2);
plot(x,y2);
xlabel('x - axis')
ylabel('y - axis')
title('cos(x) plot');
grid on;

subplot(2,2,3);
plot(x,y3);
xlabel('x - axis')
ylabel('y - axis')
title('tan(x) plot');
grid on;

subplot(2,2,4);
plot(x,y4);
xlabel('x - axis')
ylabel('y - axis')
title('sin(x)*cos(x) plot');
grid on;

Uses
-
Comparing multiple datasets visually
-
Showing steps of a process side by side
-
Displaying different aspects of the same data (e.g., histogram and boxplot)

