XAMPP Dashboard
XAMPP Dashboard
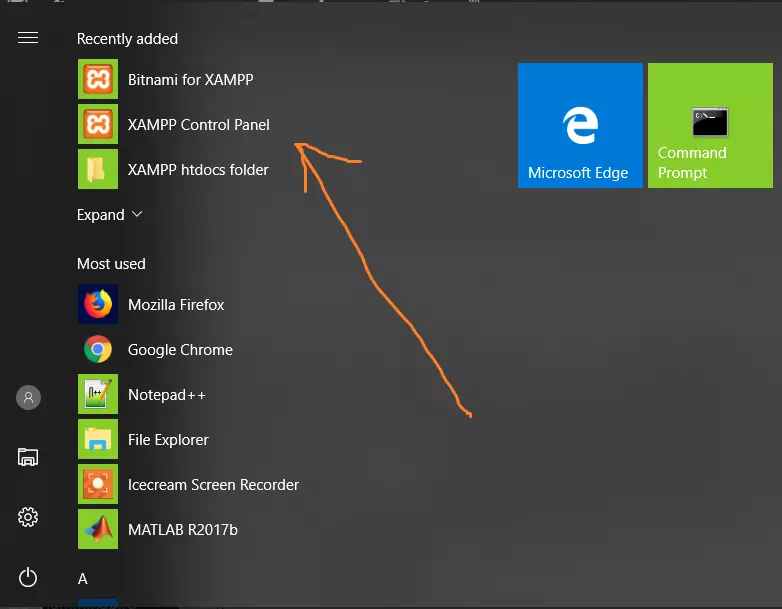
The XAMPP Dashboard is a local GUI management tool for setting up and managing a web development environment on your computer. It’s also called the XAMPP Control Panel.
XAMPP Dashboard Components
Start/Stop Services: The dashboard provides buttons to start or stop services like Apache, MySQL, FileZilla (FTP server), and Mercury (mail server).
Modules Service Status
The tool displays the current status of these services, showing whether they are running or stopped. The process ids, running ports, etc.

Admin Tools
There are links to administrative tools for managing your local server.
Apache Admin: Access the Apache server’s configuration and management interface.
MySQL Admin: Open phpMyAdmin, a web interface for managing MySQL databases.
Configuration Files: You can edit configuration files directly from the dashboard. This includes settings for Apache, MySQL, and PHP.
Config
Configuration files for services like Apache, PHP ( php.ini ) , etc.
Logs
You can access log files to troubleshoot any service issues. Logs include error messages and operational details that can help diagnose problems.
Security: XAMPP includes a security panel where you can adjust security settings, such as setting passwords for MySQL and the XAMPP admin interface.
Help and Documentation: There are links to resources and documentation to help you understand and use XAMPP effectively.
The XAMPP Dashboard is designed to make it easy to manage your local server environment for development purposes.
More information on XAMPP :
- https://www.apachefriends.org/index.html


