Error Removal Effectiveness Metrics
Overview
In this tutorial, we will discuss two important metrics for error removal effectiveness. Provided below are sample error distribution and sample weights of the different classifications of the errors.
- DERE
- DWERE
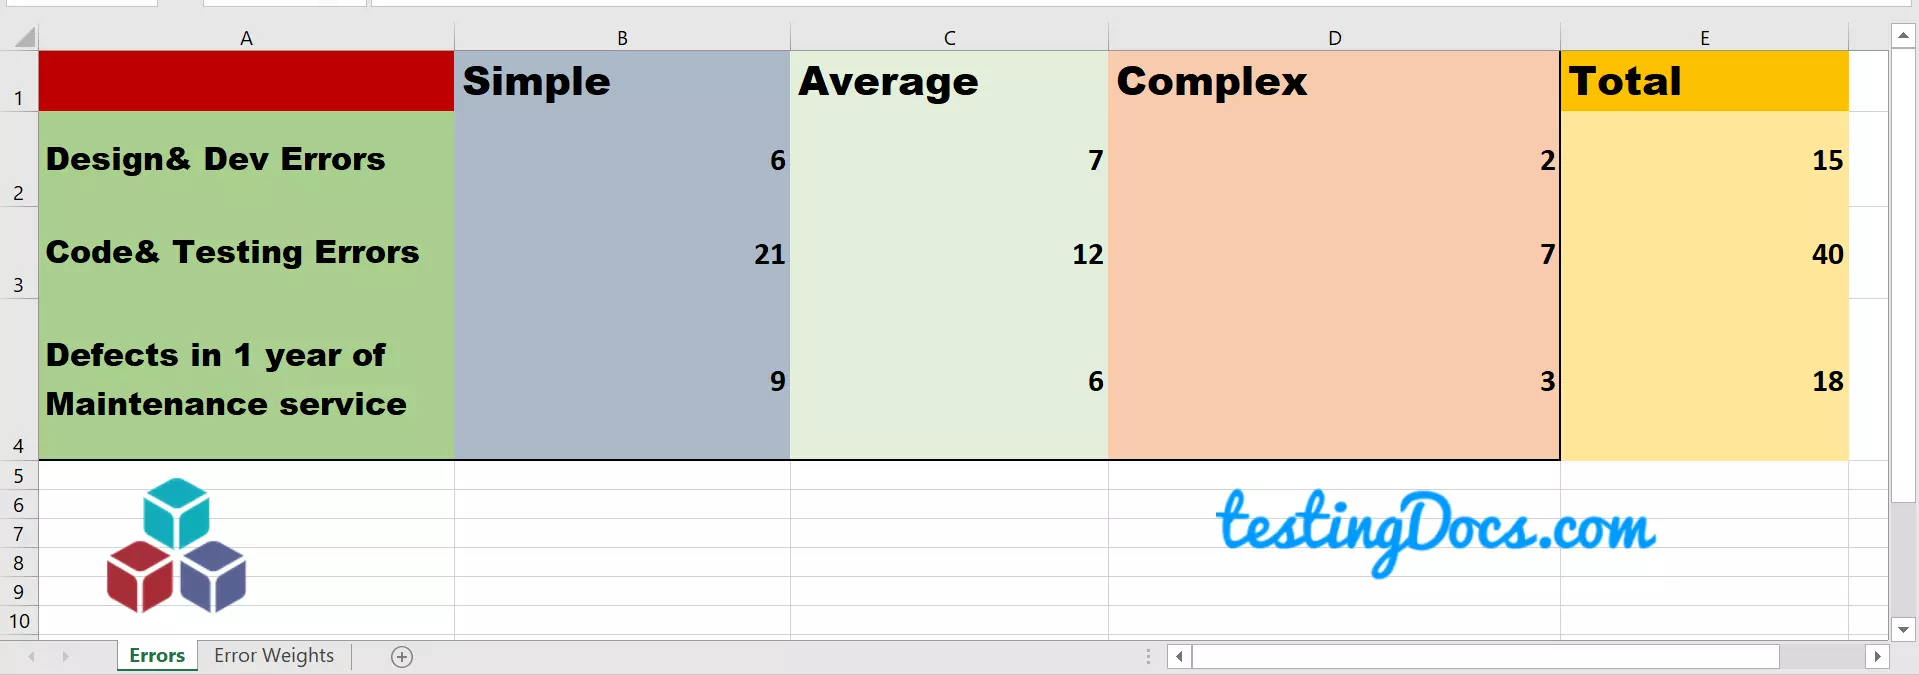
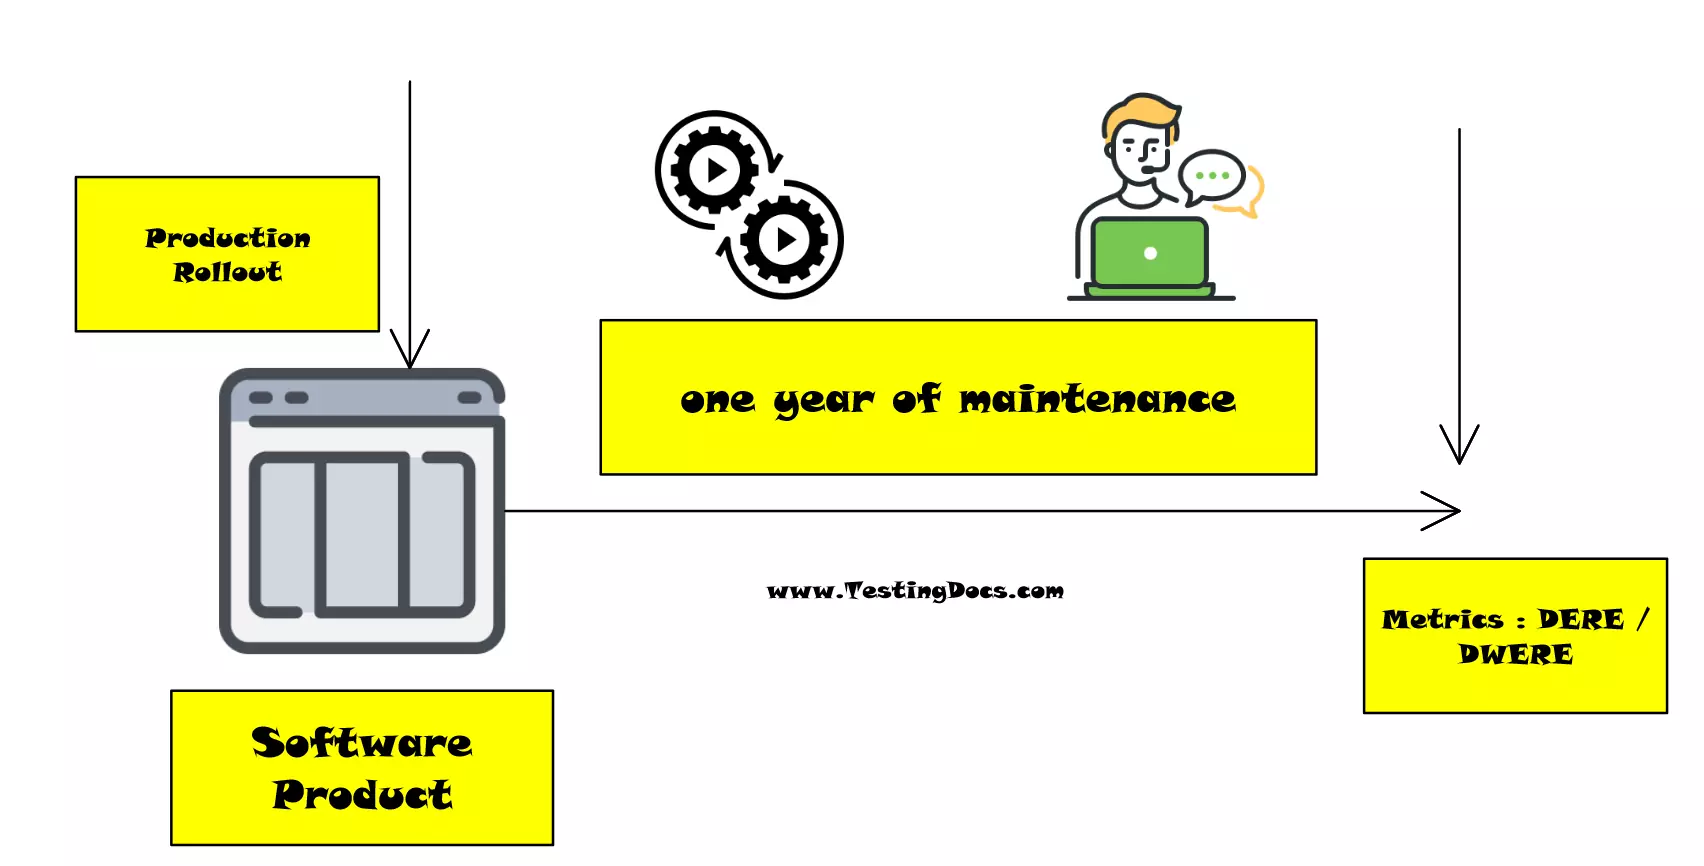
Let’s assume a Sample hypothetical project called TestingDocs with 325 KLOC and the development effort hours of 540 man-hours. The Error distribution is given below.
Errors detected Distribution: Table 1
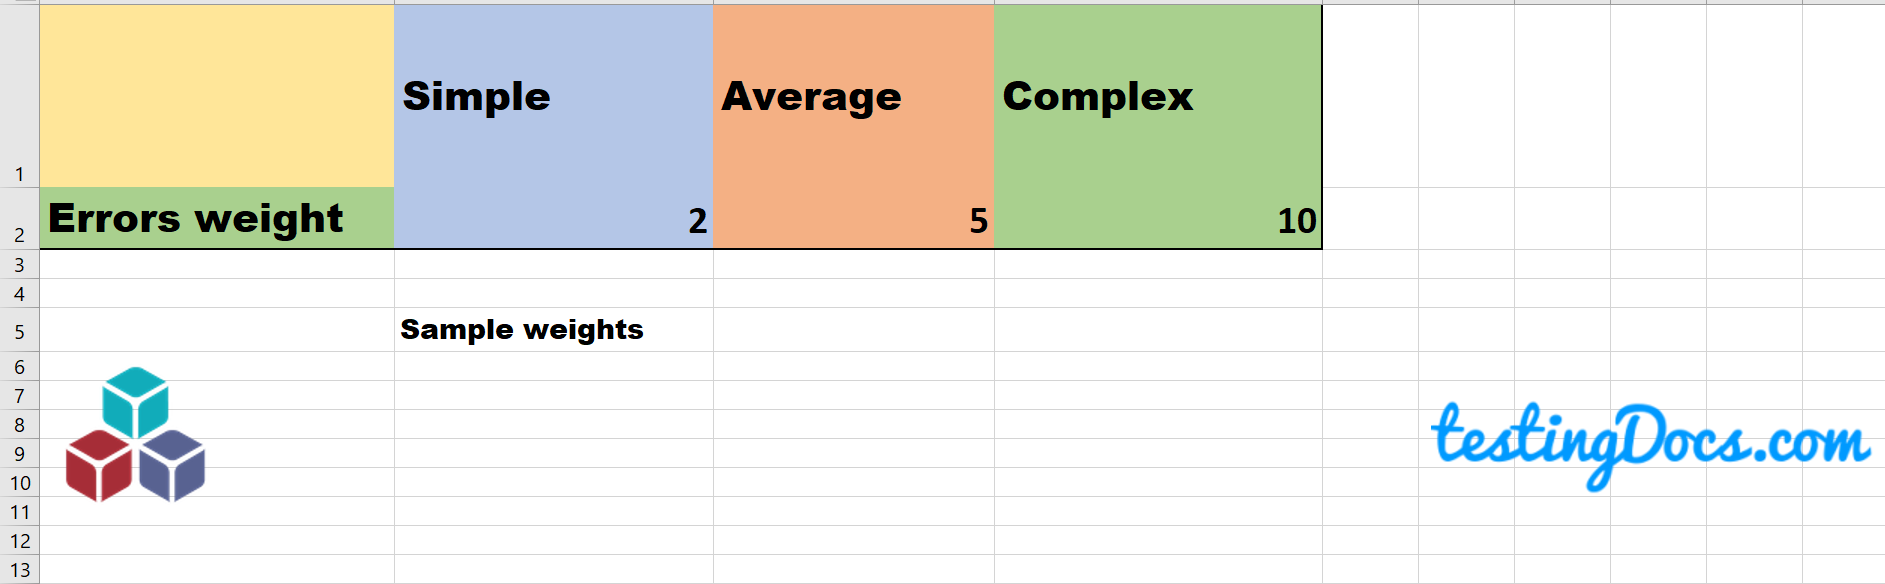
Sample Error Weights: Table 2
The sample defect weights in the project are as below. There are classified into three categories called
Simple, Average, and Complex.
DERE(Development Errors Removal Effectiveness)
DERE =
NDE = Number of Design & Development errors
NYF = Number of software failures in 1 year of Maintenance
Let’s calculate the metric for the Sample project based on the given data. Lookup the above table 1 for the number of design and development errors detected during those phases.
NDE =
NYF = Number of software failures in 1 year of Maintenance =
DERE =
= =
DWERE(Development Weighted Errors Removal Effectiveness)
DWERE =
WDE=The Weighted Development&Design Errors.
WYF = The Weighted number of software failures in 1 year of Maintenance.
Lookup both the tables 1 and 2 for the errors in the classifications and multiply with the corresponding defect weights to get the weighted score.
WDE =
=
WYF =
=
DWERE =
=
=
Error Density Metrics
https://www.testingdocs.com/error-density-metrics/