Python Bar Charts
Overview
In this tutorial, we will learn about Python Bar Charts. A Python Bar Chart is a graphical data display using bars of different heights.
Python Bar Charts
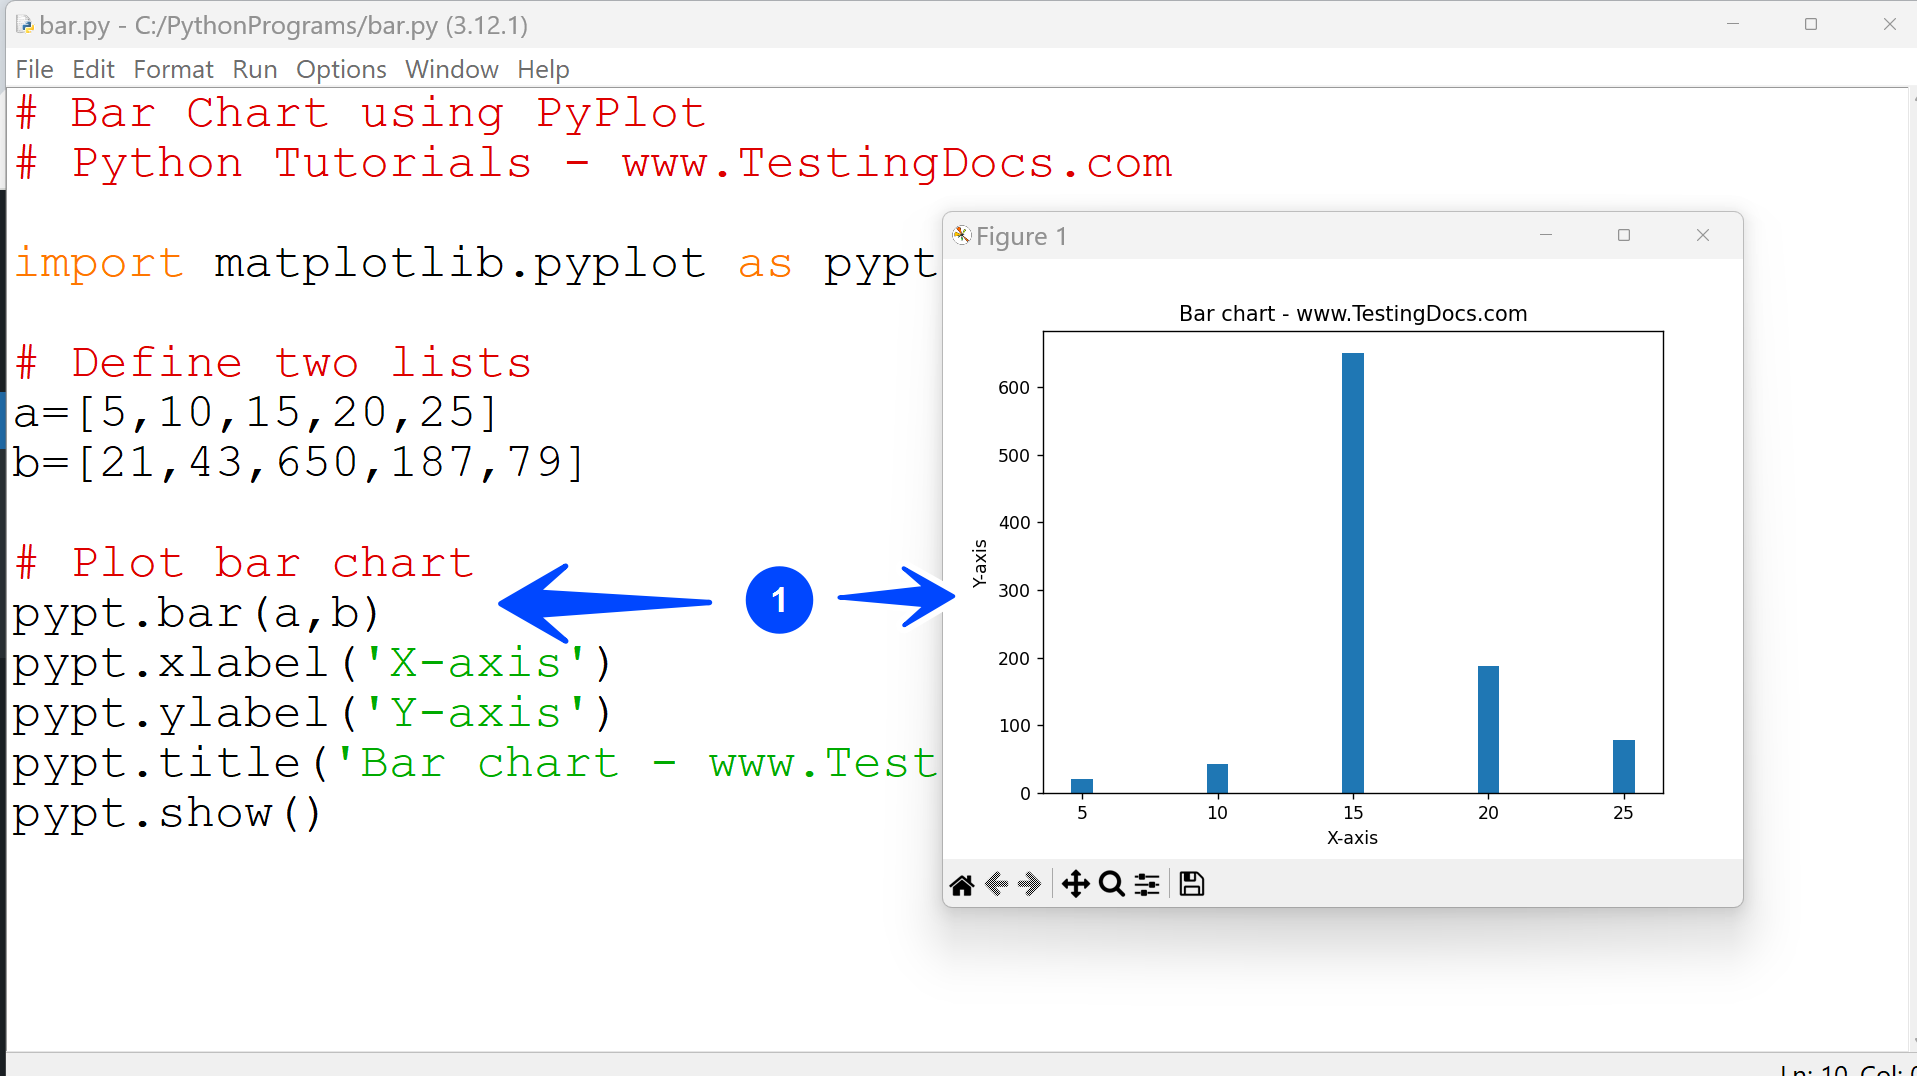
Pyplot interface offers the bar() function to create a bar chart where you can specify the sequences for the x-axis and the corresponding sequence to be plotted on the y-axis.
Syntax
The general syntax of the bar() function is as follows:
bar(data1,data2)
Example
# Bar Chart using PyPlot
# Python Tutorials – www.TestingDocs.com
import matplotlib.pyplot as pypt
# Define two lists
a=[5,10,15,20,25]
b=[21,43,650,187,79]
# Plot bar chart
pypt.bar(a,b)
pypt.xlabel(‘X-axis’)
pypt.ylabel(‘Y-axis’)
pypt.title(‘Bar chart – www.TestingDocs.com’)
pypt.show()

We can specify the x-axis label and y-axis label using the following commands:
matplotlib.pyplot.xlabel(<x axis label string>)
matplotlib.pyplot.ylabel(<y axis label string>)
Title of the bar chart using the following command:
matplotlib.pyplot.title(<title string>)
Bar width
In this section, we will learn how to change the widths of the bars in the Bar Chart.
By default, the bar chart draws bars with equal widths. (default width is 0.8 units)
Bar width can be changed as follows:
To specify a common width other than the default width for all bars, you can specify a width argument having a scalar float value in the bar( ) function.
<matplotlib.pyplot>.bar(x , y , width = <float value>)
Code
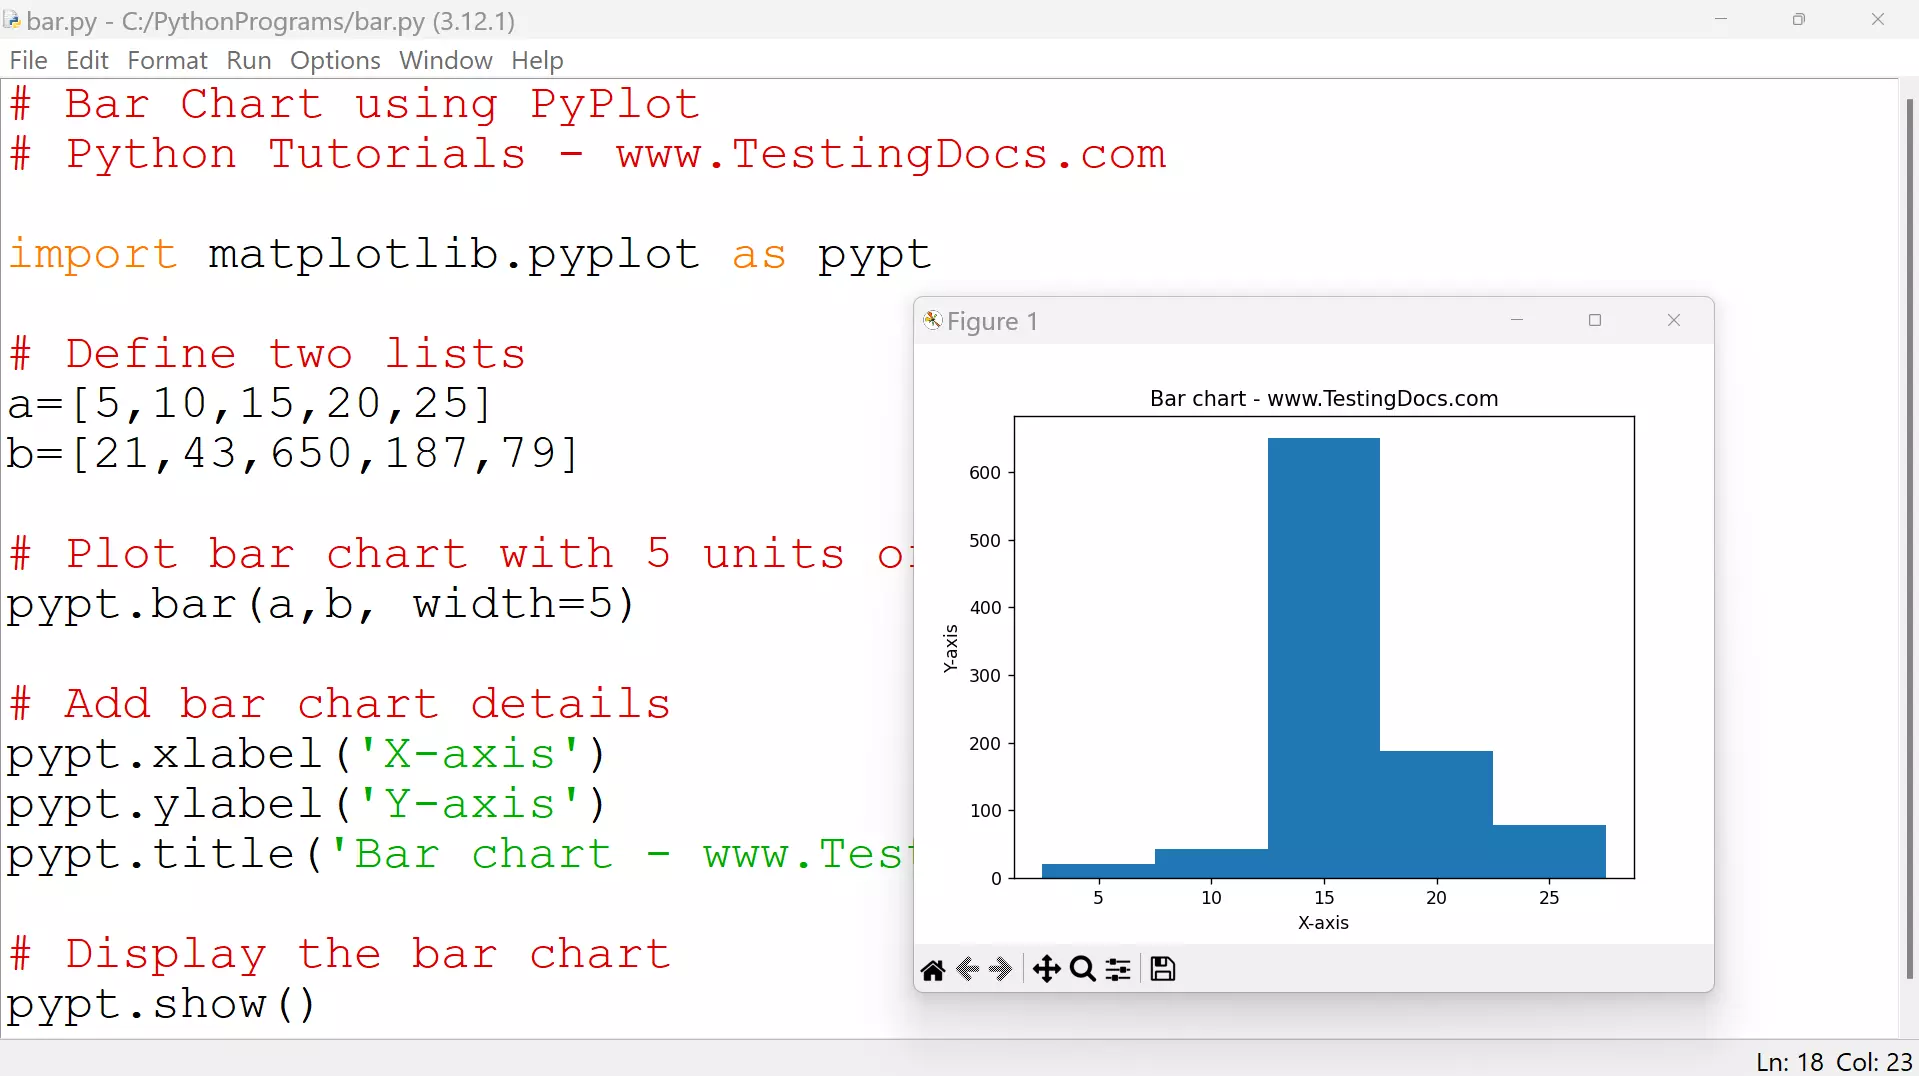
The bar width is specified as 5 units.
# Bar Chart with 5 units bar width
# Python Tutorials – www.TestingDocs.com
import matplotlib.pyplot as pypt
# Define two lists
a=[5,10,15,20,25]
b=[21,43,650,187,79]
# Plot bar chart with 5 units of width
pypt.bar(a,b, width=5)
# Add bar chart details
pypt.xlabel(‘X-axis’)
pypt.ylabel(‘Y-axis’)
pypt.title(‘Bar chart – www.TestingDocs.com’)
# Display the bar chart
pypt.show()

—
Python Tutorials
Python Tutorial on this website can be found at:
https://www.testingdocs.com/python-tutorials/
More information on Python is available at the official website:


