Software Testing Metrics
Overview
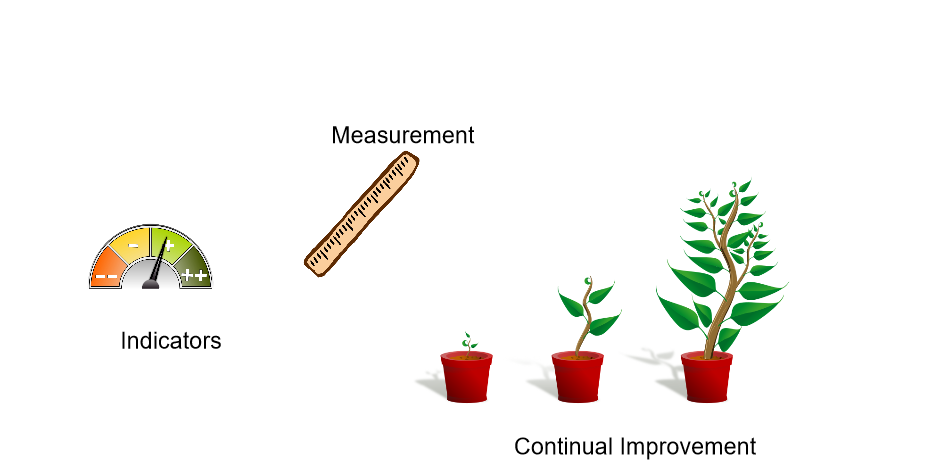
Software testing metrics provide quantifiable measures that help assess the software testing process’s quality, effectiveness, and progress.
Test Metrics provide a quantitative measure of specific attributes of the software testing and development process, thereby assisting QA teams in making informed decisions. Software testing metrics are crucial in evaluating the testing process’s efficiency, effectiveness, and progress. Test Metrics calculation enables us to measure the test artifacts’ quality and make the right decisions.

Types of Software Testing Metrics
- Base Metrics
- Derived or Calculated Metrics
Active Defects:
| Defects | Number | Description |
| Active defects by severity and priority | ||
| Active defects by the assignee | ||
All Defects:
| Defects | Number | Description |
| Active resolved and closed defects | ||
| Defects by severity and priority | ||
Test Case Coverage Metrics
Test case coverage metrics are included to identify the next priority testing tasks.
| Test Cases | Number | Description |
| Number of test cases Passed vs. Failed vs. remaining to run | ||
| Number of test cases run vs. left to run | ||
| % of test cases Passed vs. Failed vs. remaining to run | ||
| % of test cases run vs. left to run |
Automation Test Case Coverage Metrics
Automation Test case coverage metrics are included to identify the next priority automation testing tasks. (Code reviews, skipped test cases root cause, valid automation failures or false negatives, etc.)
| Automated Test Cases | Number | Description |
| Number of Automated test cases Passed vs. Failed vs. Skipped remaining to run | ||
| Number of Automated test cases Run vs. Skipped left to run | ||
| % of Automated test cases Passed vs. Failed vs. Skipped remaining to run |


