Visualize work with Kanban Board
Visualize work with Kanban Board
In this tutorial, we will learn about Kanban Board. The tool is widely used to visualize the work by the teams. The basic Kanban board might have like To-do, In Progress, and Done columns.
What is Kanban Board?
Kanban is a methodology and scheduling system for Lean manufacturing. However, project teams use this methodology to manage their projects efficiently. The Kanban board is the simple way to know the current status of a project’s tasks. It’s a visual representation of tasks and is easy to understand.
The usual approach of the Kanban is that the teams use sticky Post-it notes on white board/cards to keep track of the work. In this tutorial, we will use an open-source tool called Kanboard tool.
Kanboard Tool
Kanboard is a free and open source Kanban project management software. The tool has simple UI and can be self hosted on Apache server with PHP configuration.
The tool can be installed on LAMP or WAMP stack. LAMP stack components install guide:
Sample Kanban Board
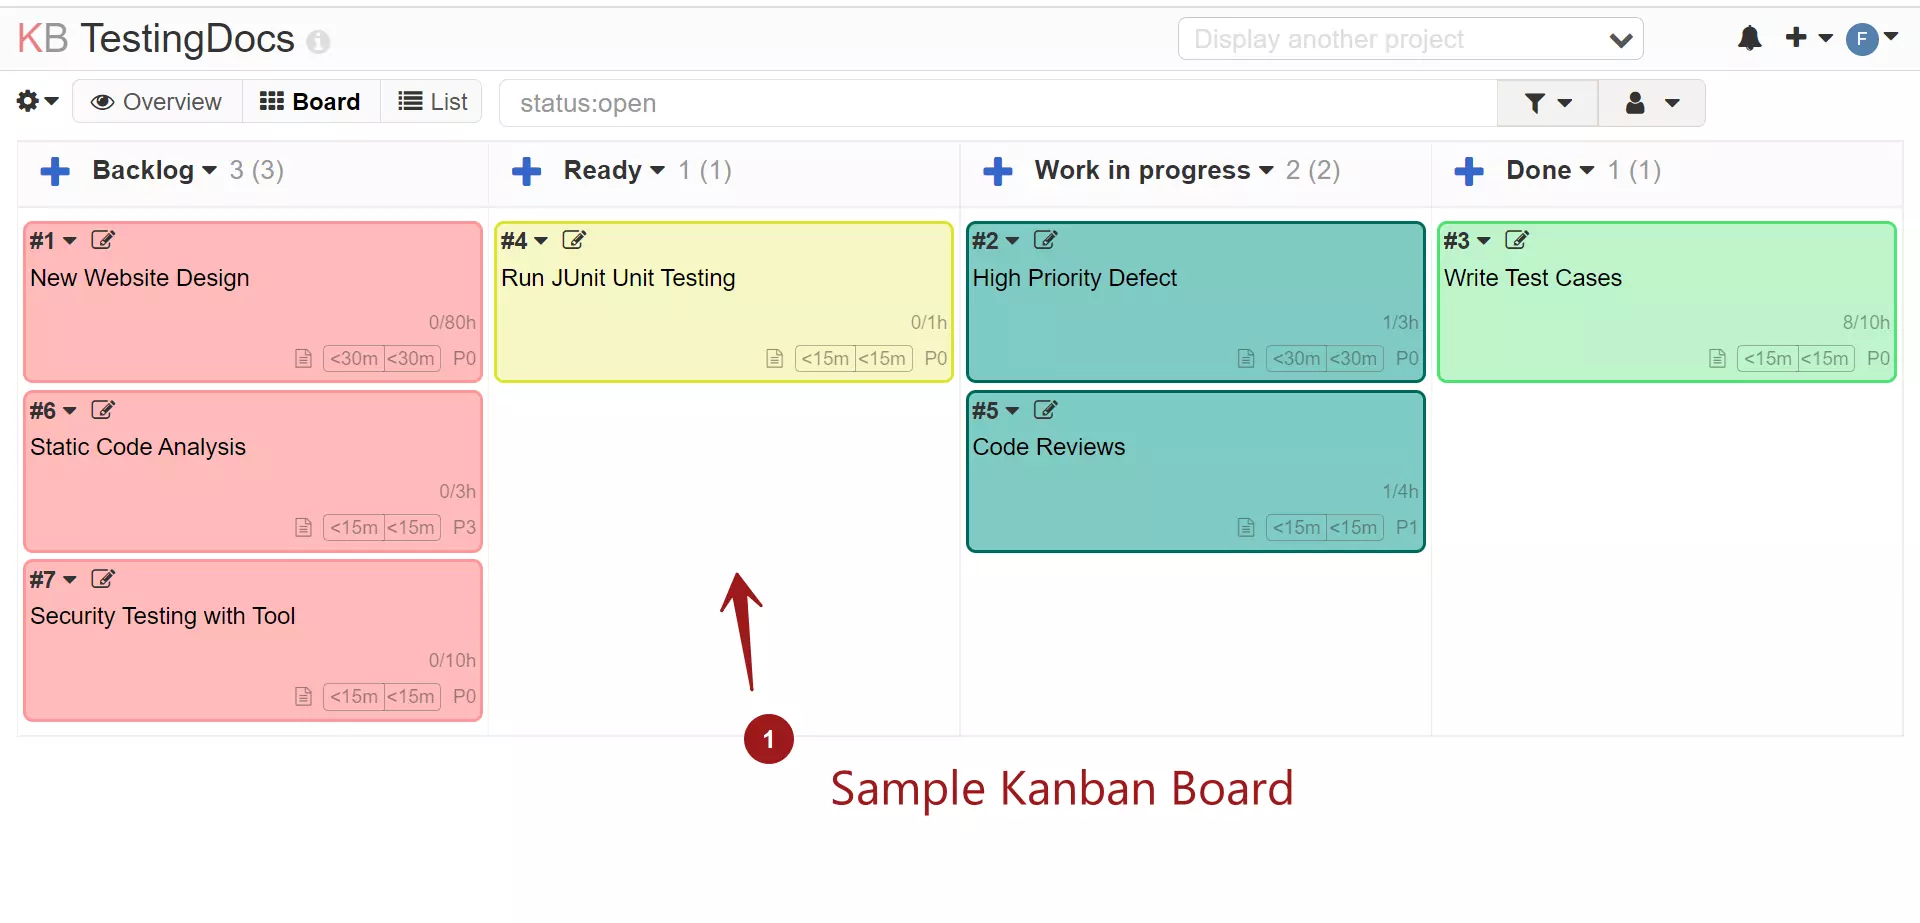
Board Items
The board has four task columns:
- Backlog
- Ready ( T0-Do)
- Work In progress(Doing/Ongoing)
- Done
Each column represents a phase of the task that needs to be completed by the team. The teams start with Backlog of items. Work task items are pulled from the Backlog column.
The board is useful for self motivated teams to visualize and track the work in progress and achieve business goals. Kanban is continuous and changes can be made at anytime.
Kanban is simple framework and has advantages over Scrum. Unlike Scrum framework which has lot of meetings like backlog grooming, retrospectives etc.
Link: https://kanboard.org/
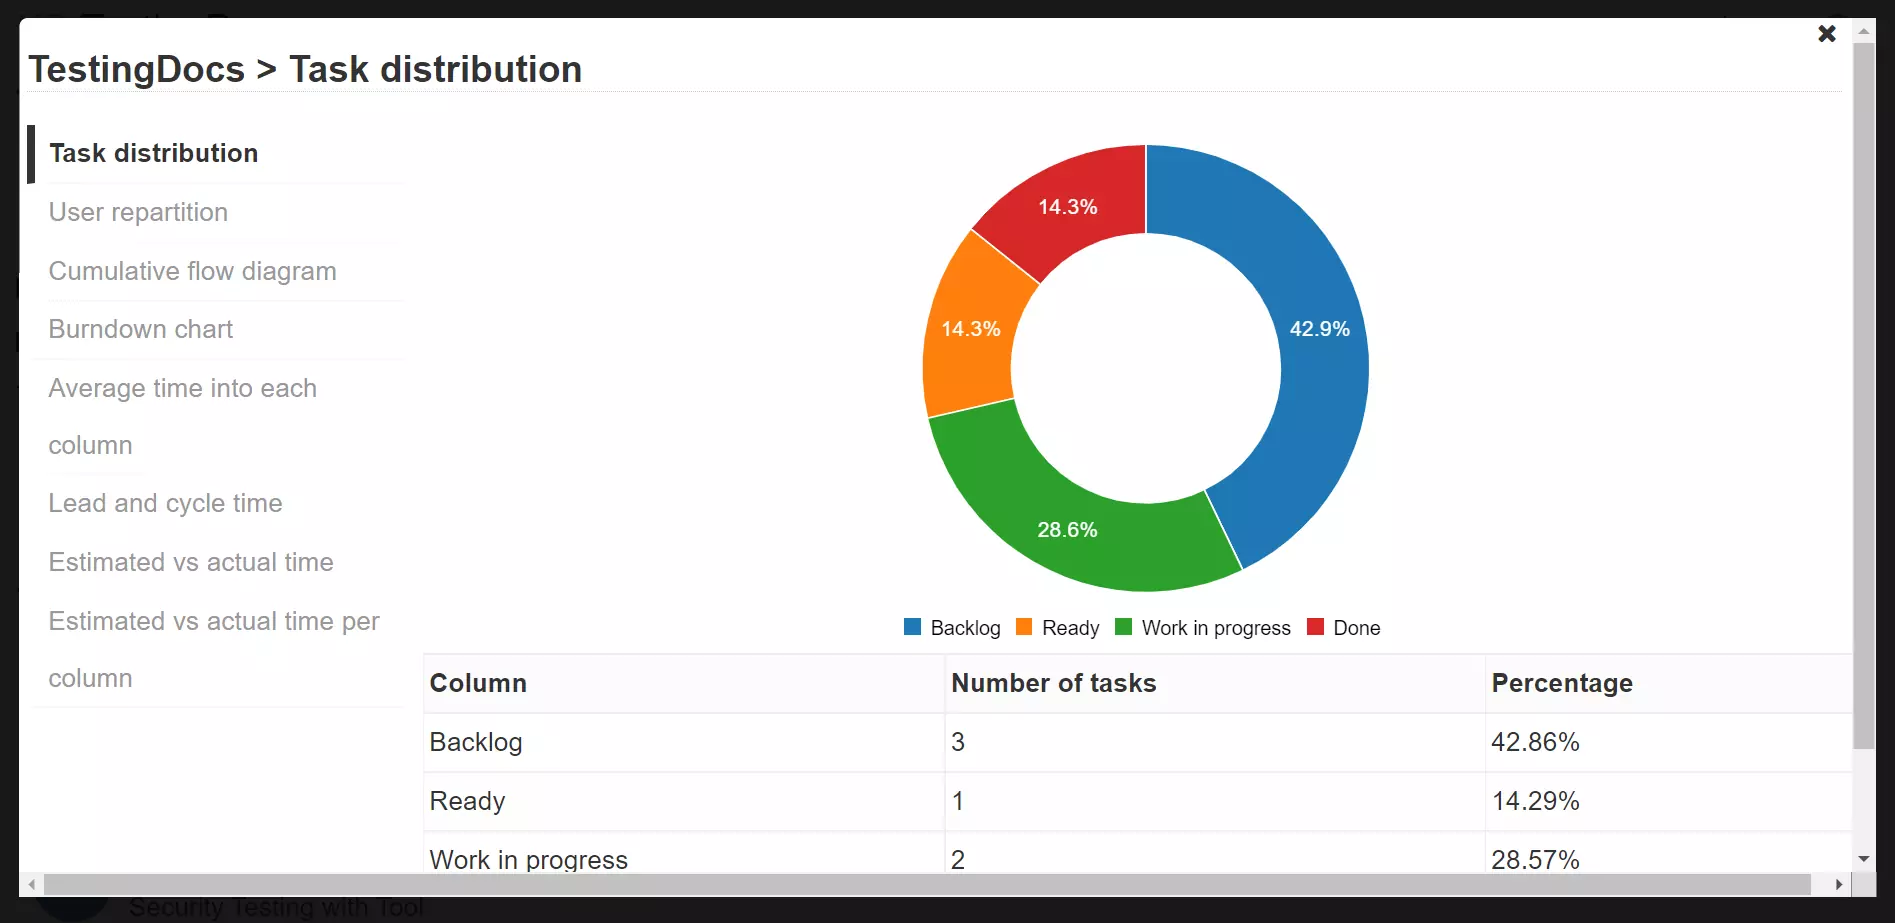
Task Distribution
Task analysis and the distribution chart to know the percentage of work remaining.
Alternative Views
There are alternative views for the board. Some of the alternatives are:
- List
- Timeline( Gantt Chart)
- Calendar