Average of Three Numbers Flowchart
Overview
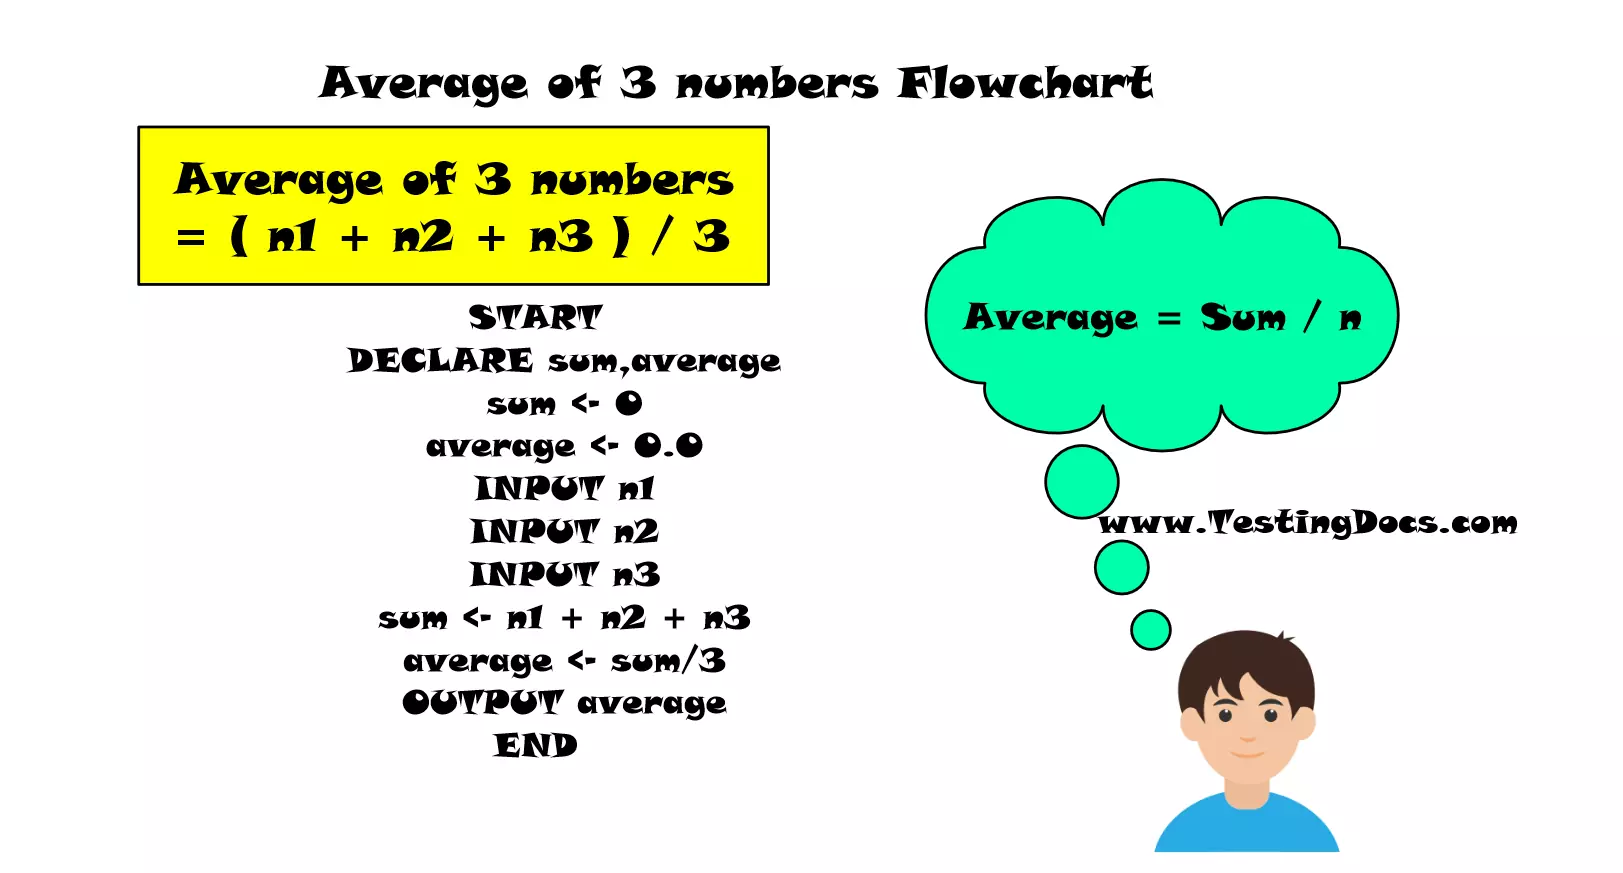
In this post, we will model a flowchart to find the average of three numbers. In general, the average of n numbers is computed as:
sum = Sum of n numbers
Here, to calculate the average of three numbers n = 3
Example
Let’s compute the average of the three numbers by hand. Let the three numbers be n1, n2, and n3.
For example, let’s assume the numbers are as follows:
n1= 31,
n2 = 43
n3 = 97.
In the first step, we need to compute the sum of the three numbers.
sum = 31 + 43 + 97
= 171
In the second step, we need to compute the average of the three numbers.
Average = 171/ 3
= 57
IPO chart
IPO chart for the average of three numbers flowchart
| Input | Process | Output |
| Three numbers n1,n2,n3 | AverageOfThree = (n1 + n2 + n3)/3
|
Output displayed by the flowchart
AverageOfThree |
Pseudocode
 RAPTOR Flowchart
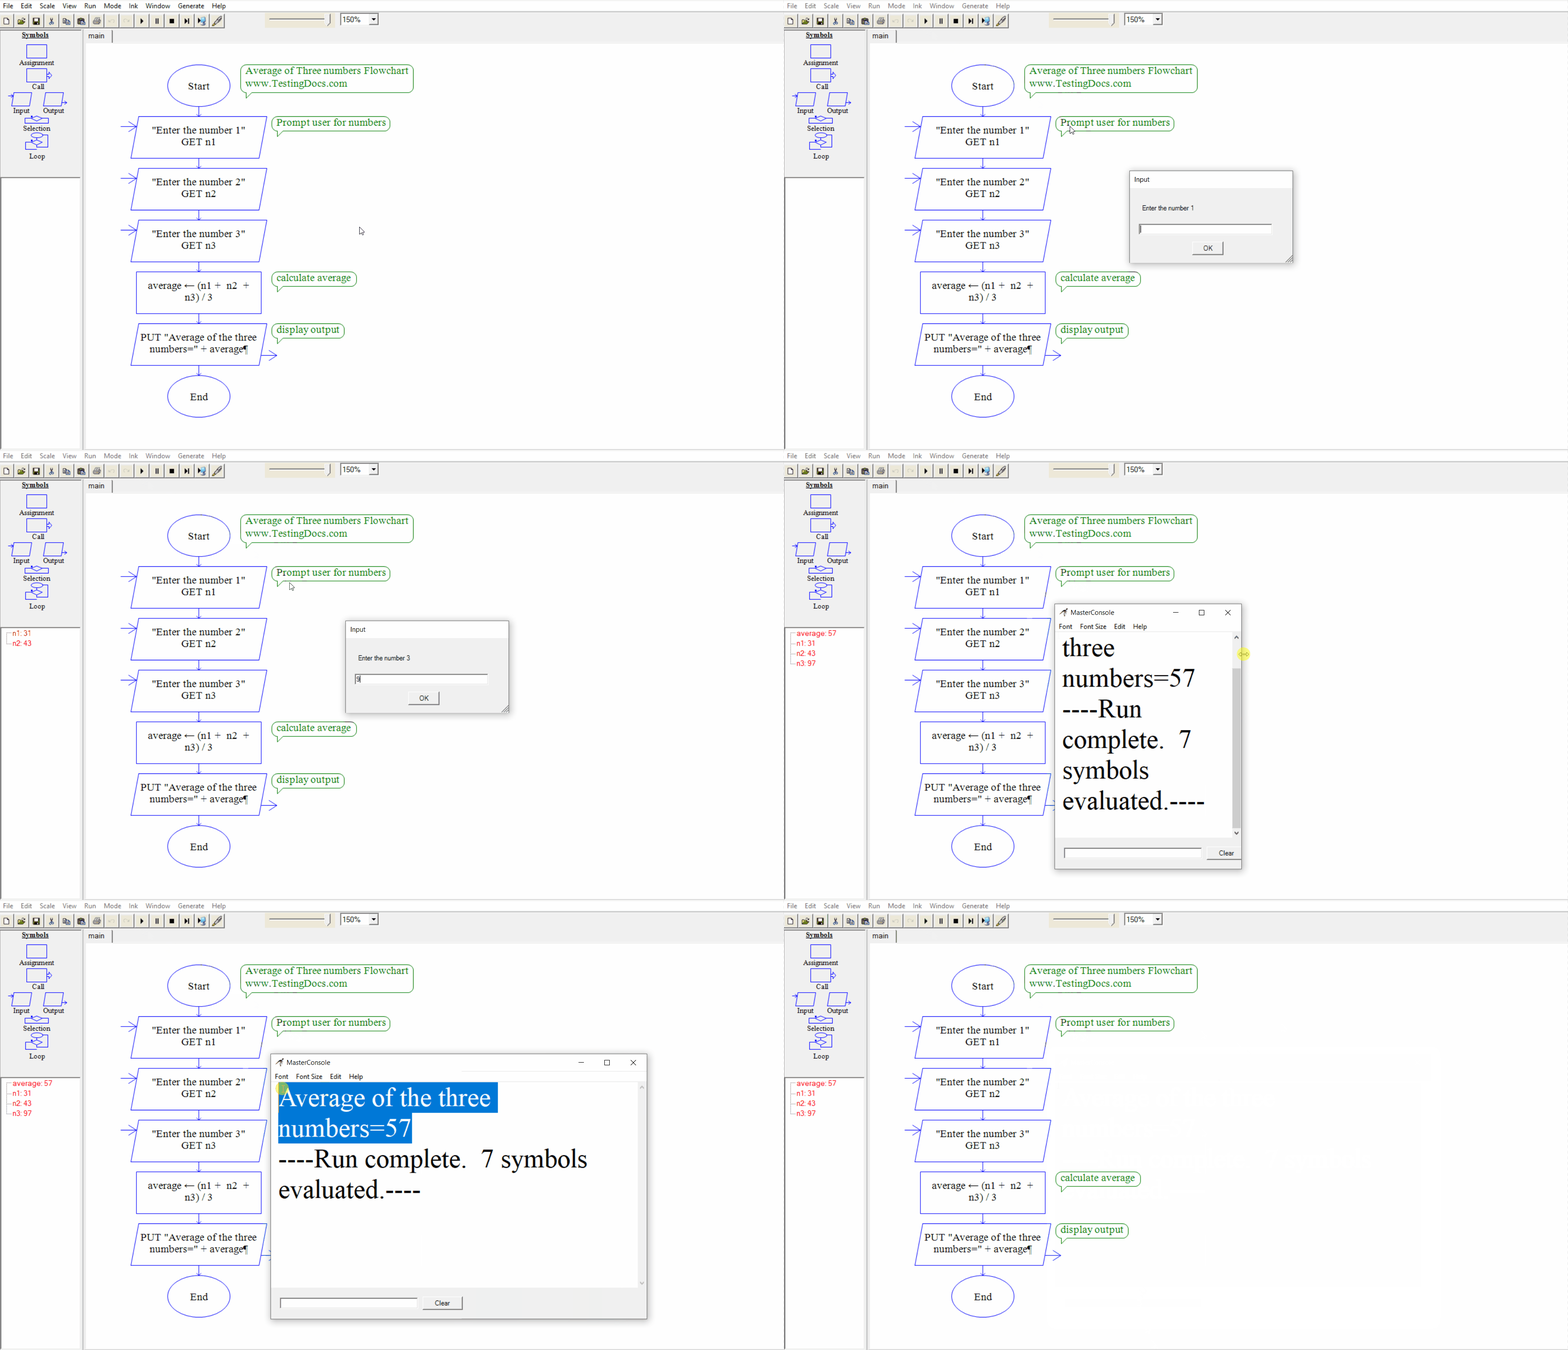
We will prompt the user to enter three numbers. In the flow chart, we will compute the average of the user-entered numbers. In the end, will display the result i.e average of the three numbers.
Let the numbers are: n1, n2, and n3
We will store the average in the variable: averageOfThree
Prompt the user with the numbers.

- Drag and drop the three Input symbols to the workspace.
- Compute the average :
- average = (n1 + n2 + n3 ) /3
- Drag and Drop the Assignment symbol. Perform the computation.
- Display the average.
- Drag and drop the output symbol and print the result.
- Execute the flow chart.
Flowchart Output
Let’s execute a sample test case to test the output of the flowchart. The flowchart should be tested and the output should be validated for proper working.
| Test Case Scenario | Detailed Steps | Test Data | Expected Result | Actual Result |
| Add three numbers. | Launch Raptor.
Execute the flowchart. Enter three numbers as input. |
31
43 97 |
57 |
Run the flowchart and enter the three numbers.

We can see in the output in the MasterConsole window that the output is displayed.
Using Array
To compute the average for more numbers i.e n> 3 the disadvantage of this approach is to maintain n
variables to hold the numbers. i.e n1,n2,n3 …. n
We can use an array to hold the numbers. Arrays are used to hold the variables of the same data type.
To compute the average of more variables using an array:
RAPTOR Tutorials
RAPTOR tutorials on this website can be found here:
https://www.testingdocs.com/raptor-a-flowchart-tool/
Flowchart examples:
https://www.testingdocs.com/raptor-flowchart-examples/
RAPTOR official website:


