Sprint Burndown Chart
Introduction
The sprint burndown chart is a tool to track the total work remaining in the sprint of a project. It is a graphical representation of the likelihood of achieving the sprint goal. This helps the scrum team to manage its progress and respond accordingly.
A graphical representation of Work Remaining versus Time Remaining. As a result, the graph acts as an effective tool for communicating progress to meet product/project delivery expectations.
Jira Software
Anatomy of the chart
The burndown chart can be formulated in many ways and depends on the Agile tool used
for tracking the sprint backlog. Let’s take the Jira Cloud tool.
For example,
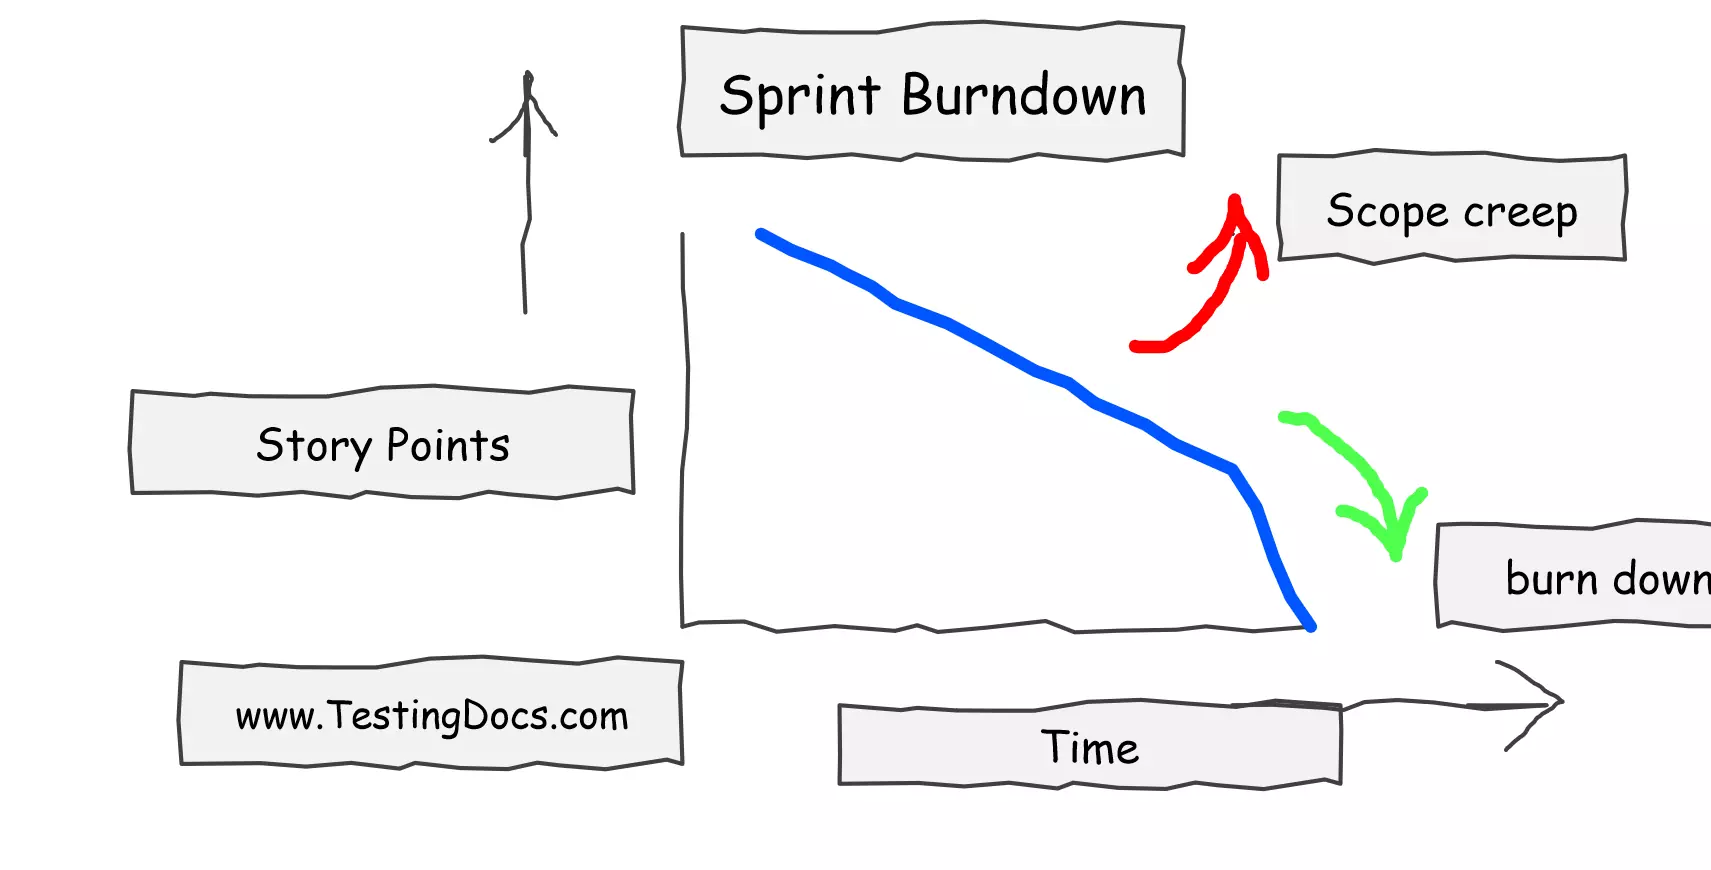
Story points/ Issue Count on Y-axis.
Time of the sprint on the X-axis.
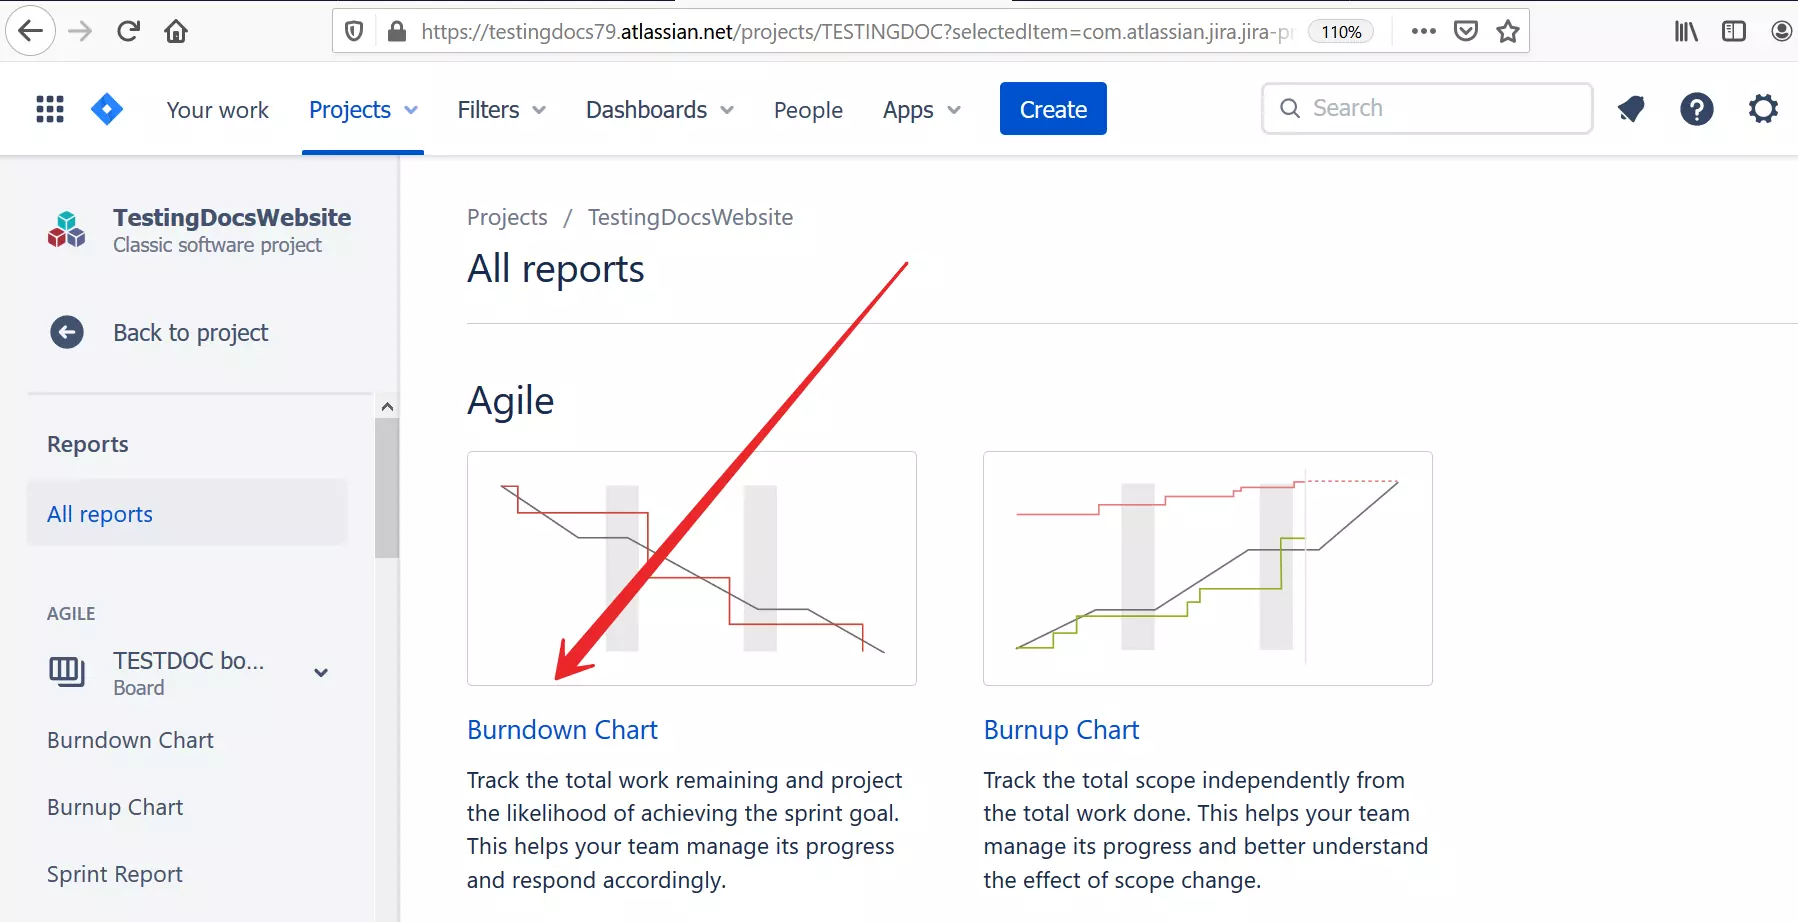
Steps to view the chart
- Select the project.
- Select the Agile board.
- Click on the Reports >> All Reports.
- Click on the Burndown Chart.

Sprint Burndown Chart
Sample burndown chart story points on the Y-axis. Time( working days in a sprint) on the X-axis.

Scope creep
Scope creep is changes to the sprint scope that affects the sprint goal completion. For example, adding user stories, issues, or unplanned tasks in the middle of the sprint or after the sprint planning.
Burndown
Burndown is the activity of completing the project artifacts to the Done stage. For example, completing user stories, marking the task, issues as Done, etc.


