Flowgorithm Turtle Graphics Flowchart
Flowgorithm Turtle Graphics Flowchart
In this tutorial, we will learn to design Flowgorithm Turtle Graphics Flowchart. Turtle Graphics is a new feature in the Flowgorithm 3.0 version. The introduction of Turtle graphics is an additional tool for teaching programming skills. The goal is to teach programming concepts through the sequential steps required to create an image.
New Features
To know more about the new features:
Prerequisites
We need to have the Flowgorithm 3.x version installed on the computer to draw Turtle Graphics. We have two options to get the latest version.
- Install a fresh copy of Flowgorithm 3.x version.
- Update the existing older version to the latest version.
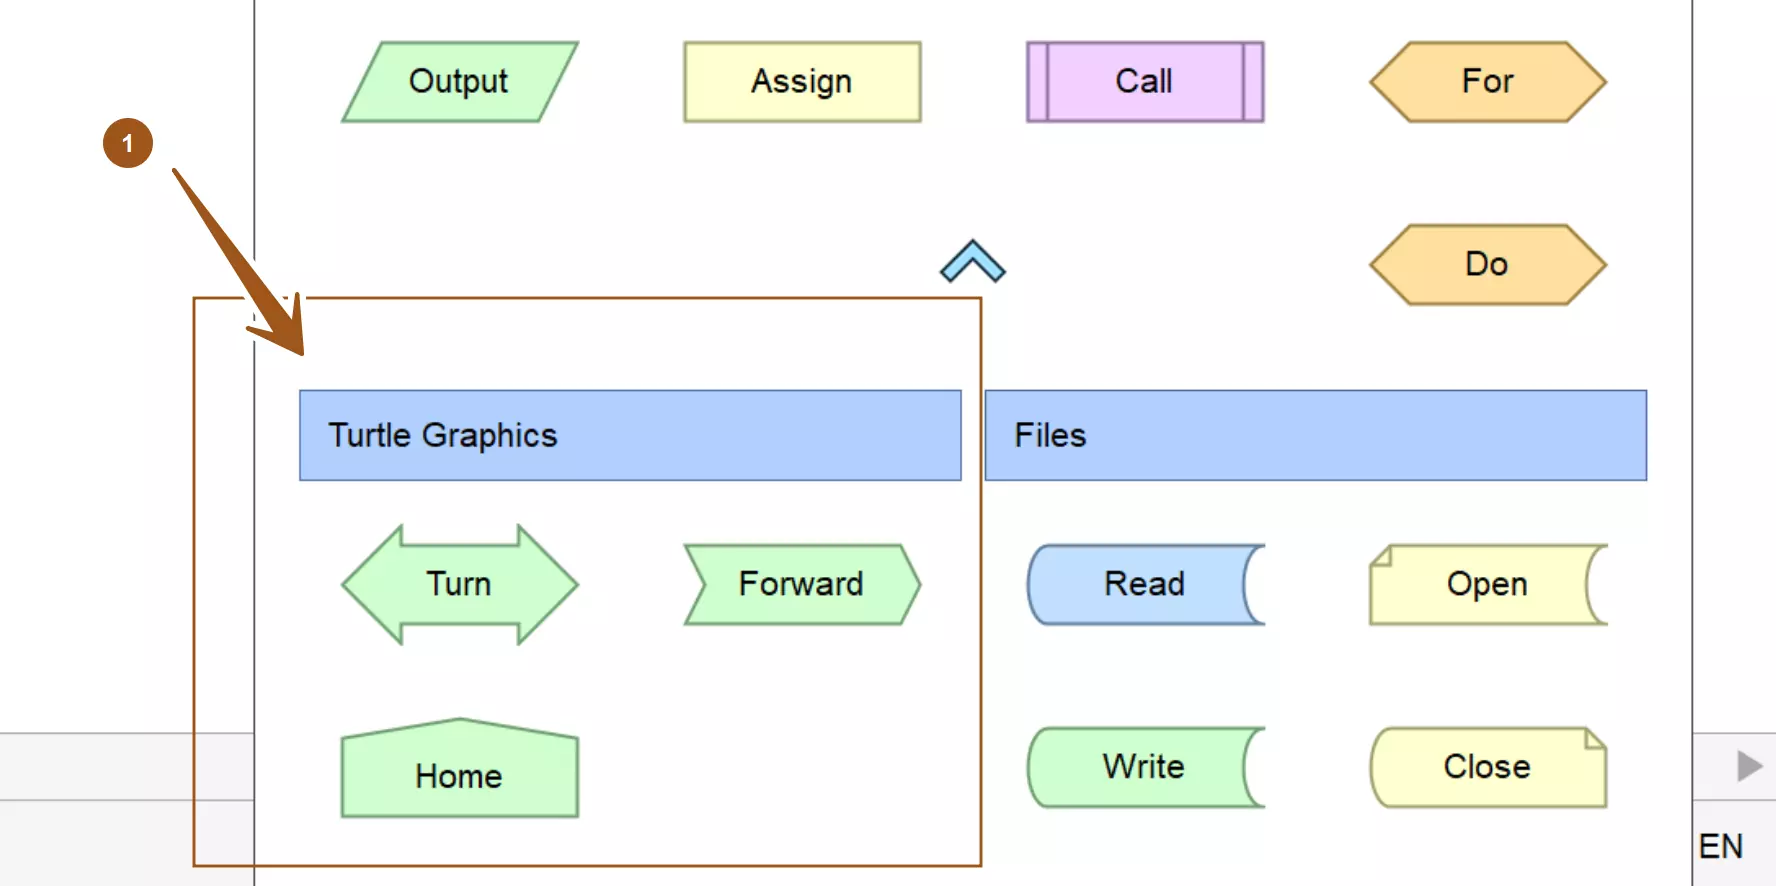
Turtle Graphics Symbols
Flowgorithm supports three shapes to draw graphics.
To understand the new flowchart shapes:
https://www.testingdocs.com/flowgorithm-turtle-graphics/
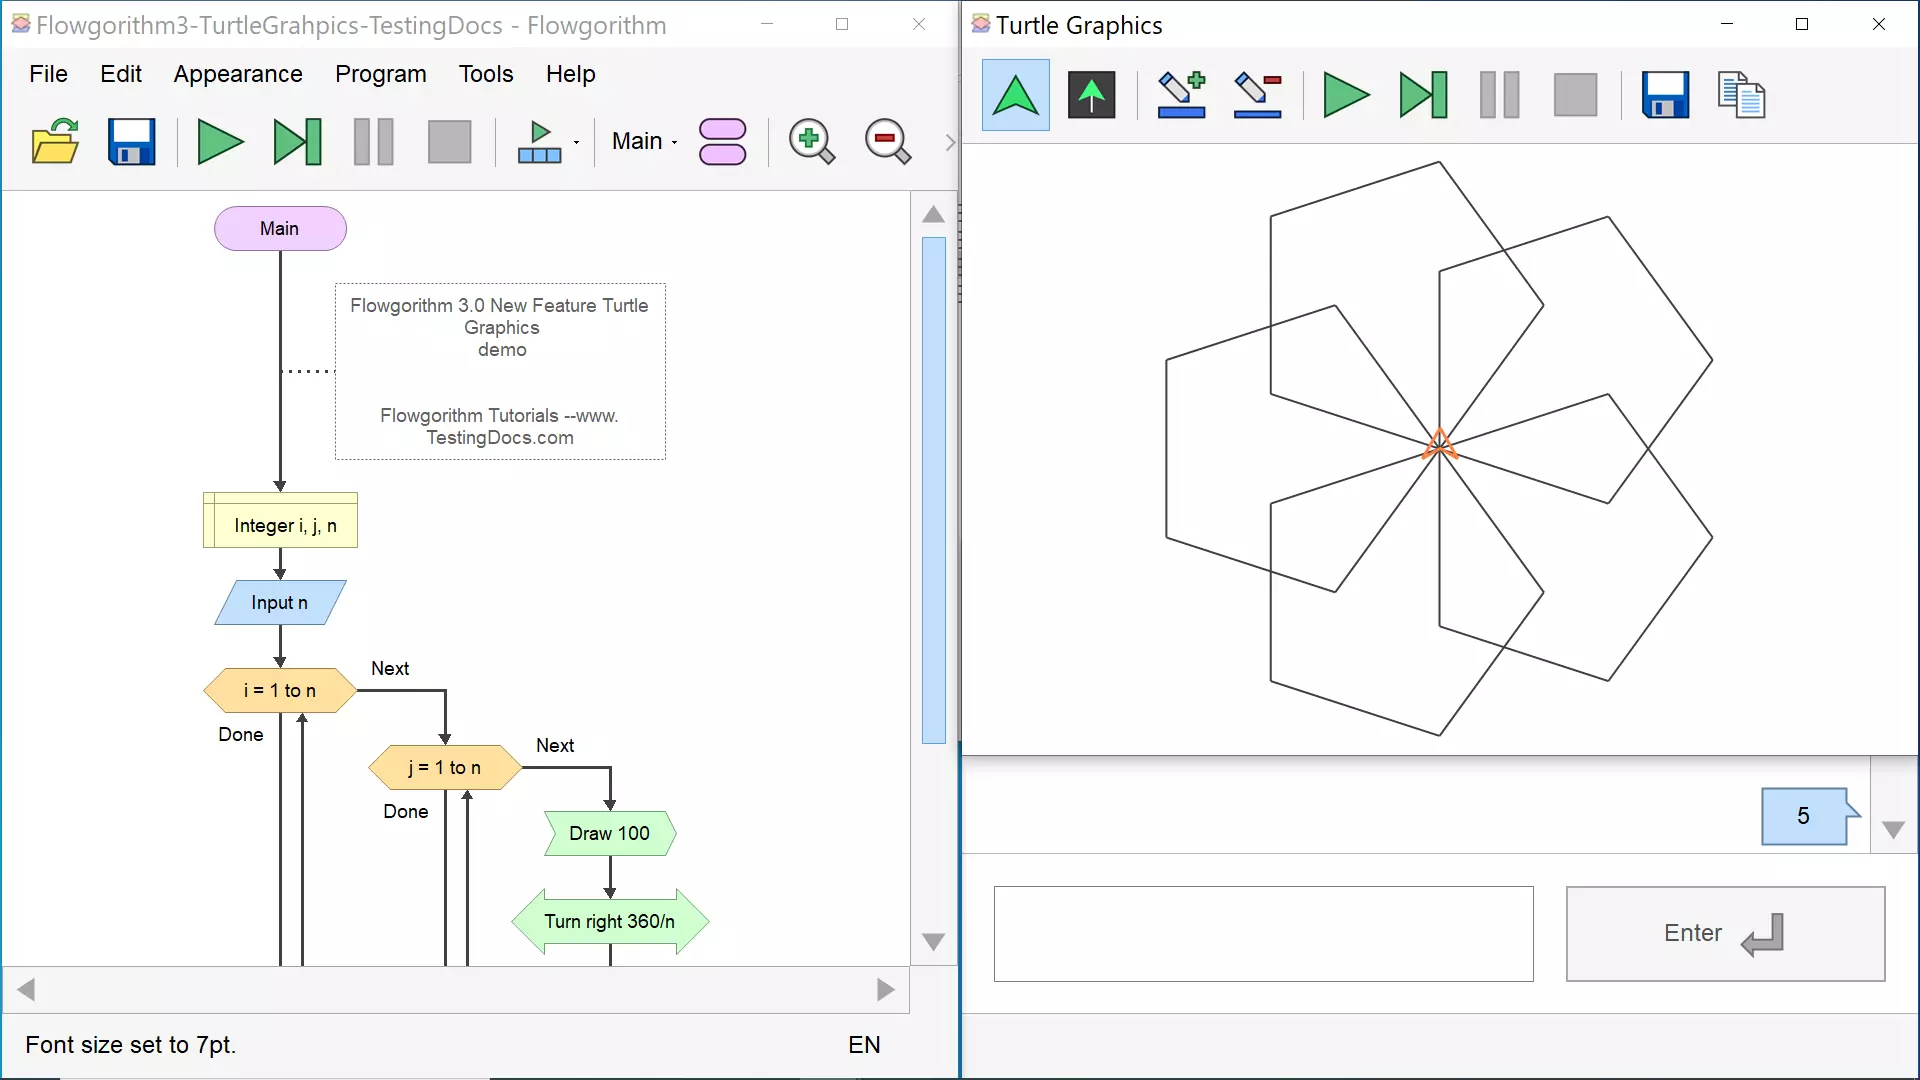
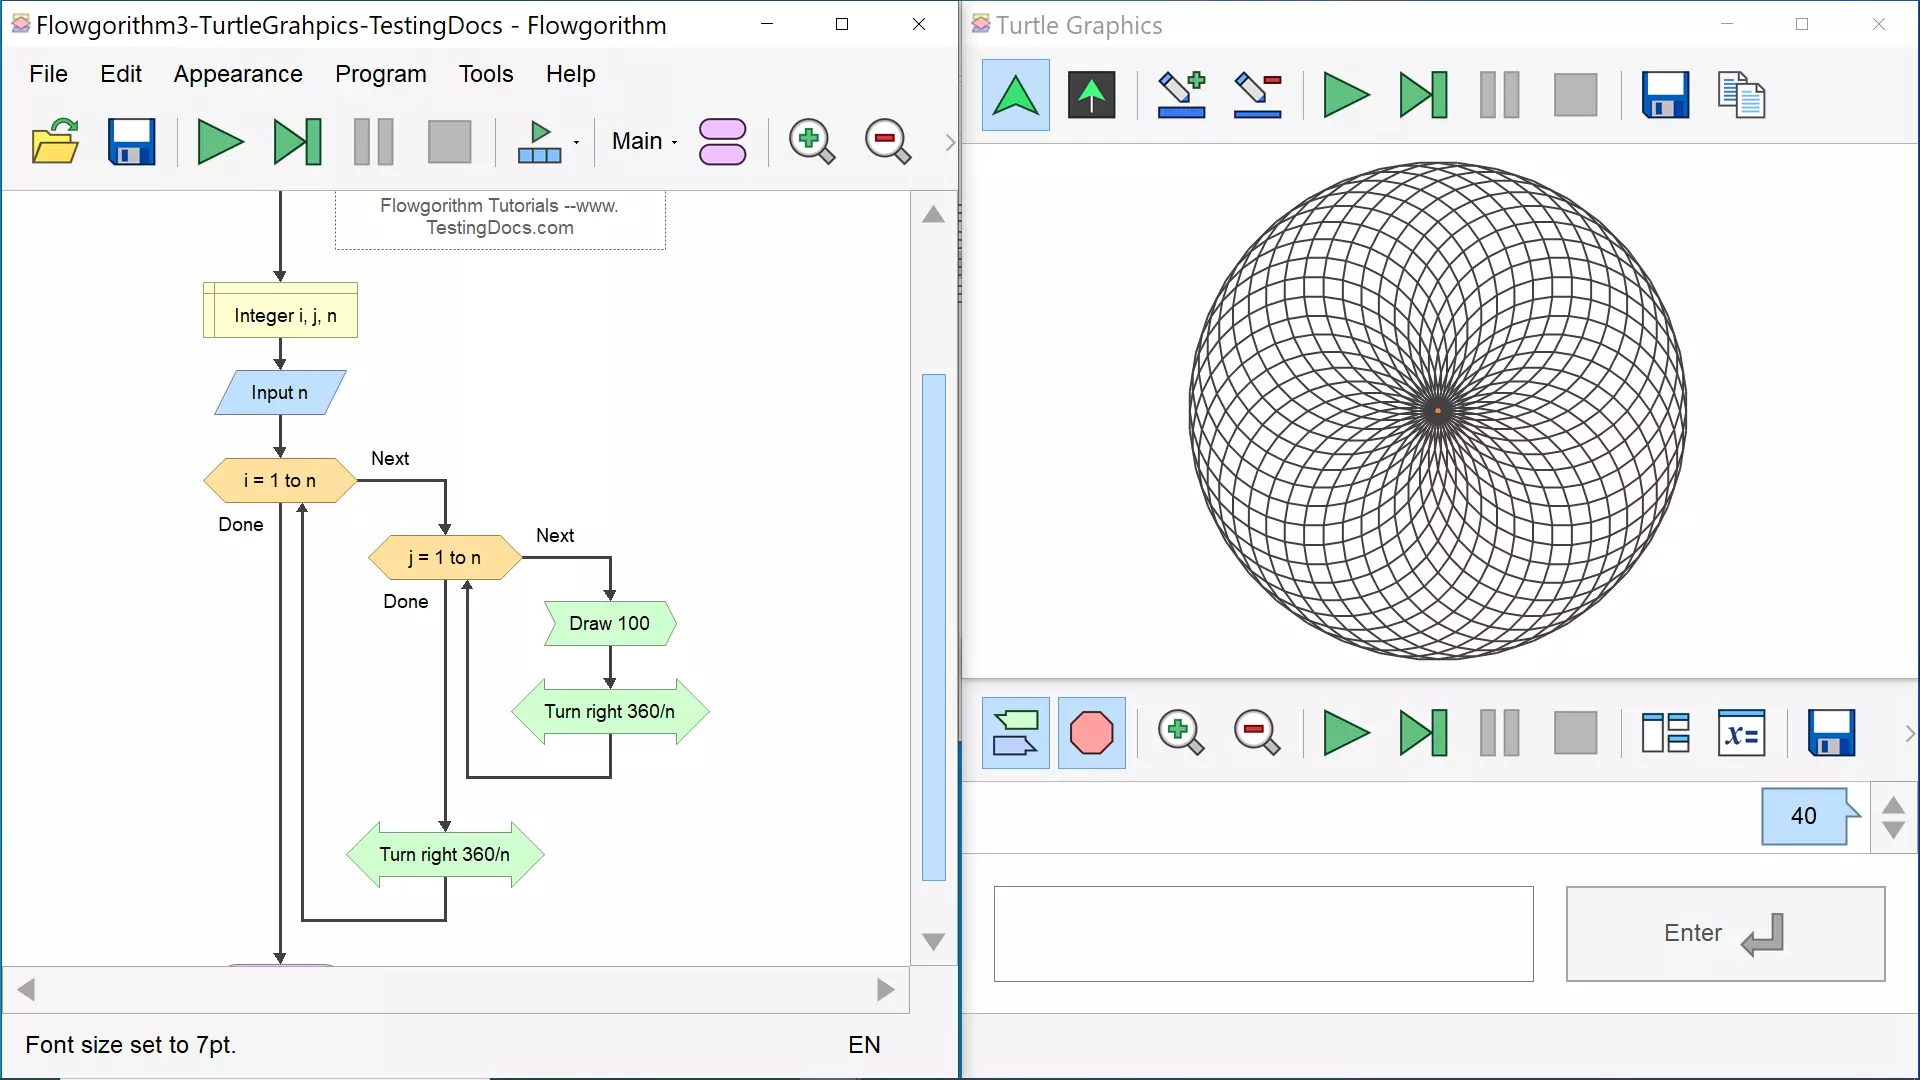
Sample Turtle Graphics Flowchart
Let’s create a sample drawing using the Turtle Graphics feature.
- Declare three variables.
- Take the input for the number of sides from the user.
- We will use two For loops to create the drawing.
- The inner loop draws a single figure.The inner loop draws a line and rotates some degrees to the right based on the user input n.
- For example, if the user input n=6, the turtle in the inner loop rotates 60 degrees after drawing the line. Each inner loop draws a hexagon for the input n=6.
- The outer loop tilts the Turtle and repeats the drawing.
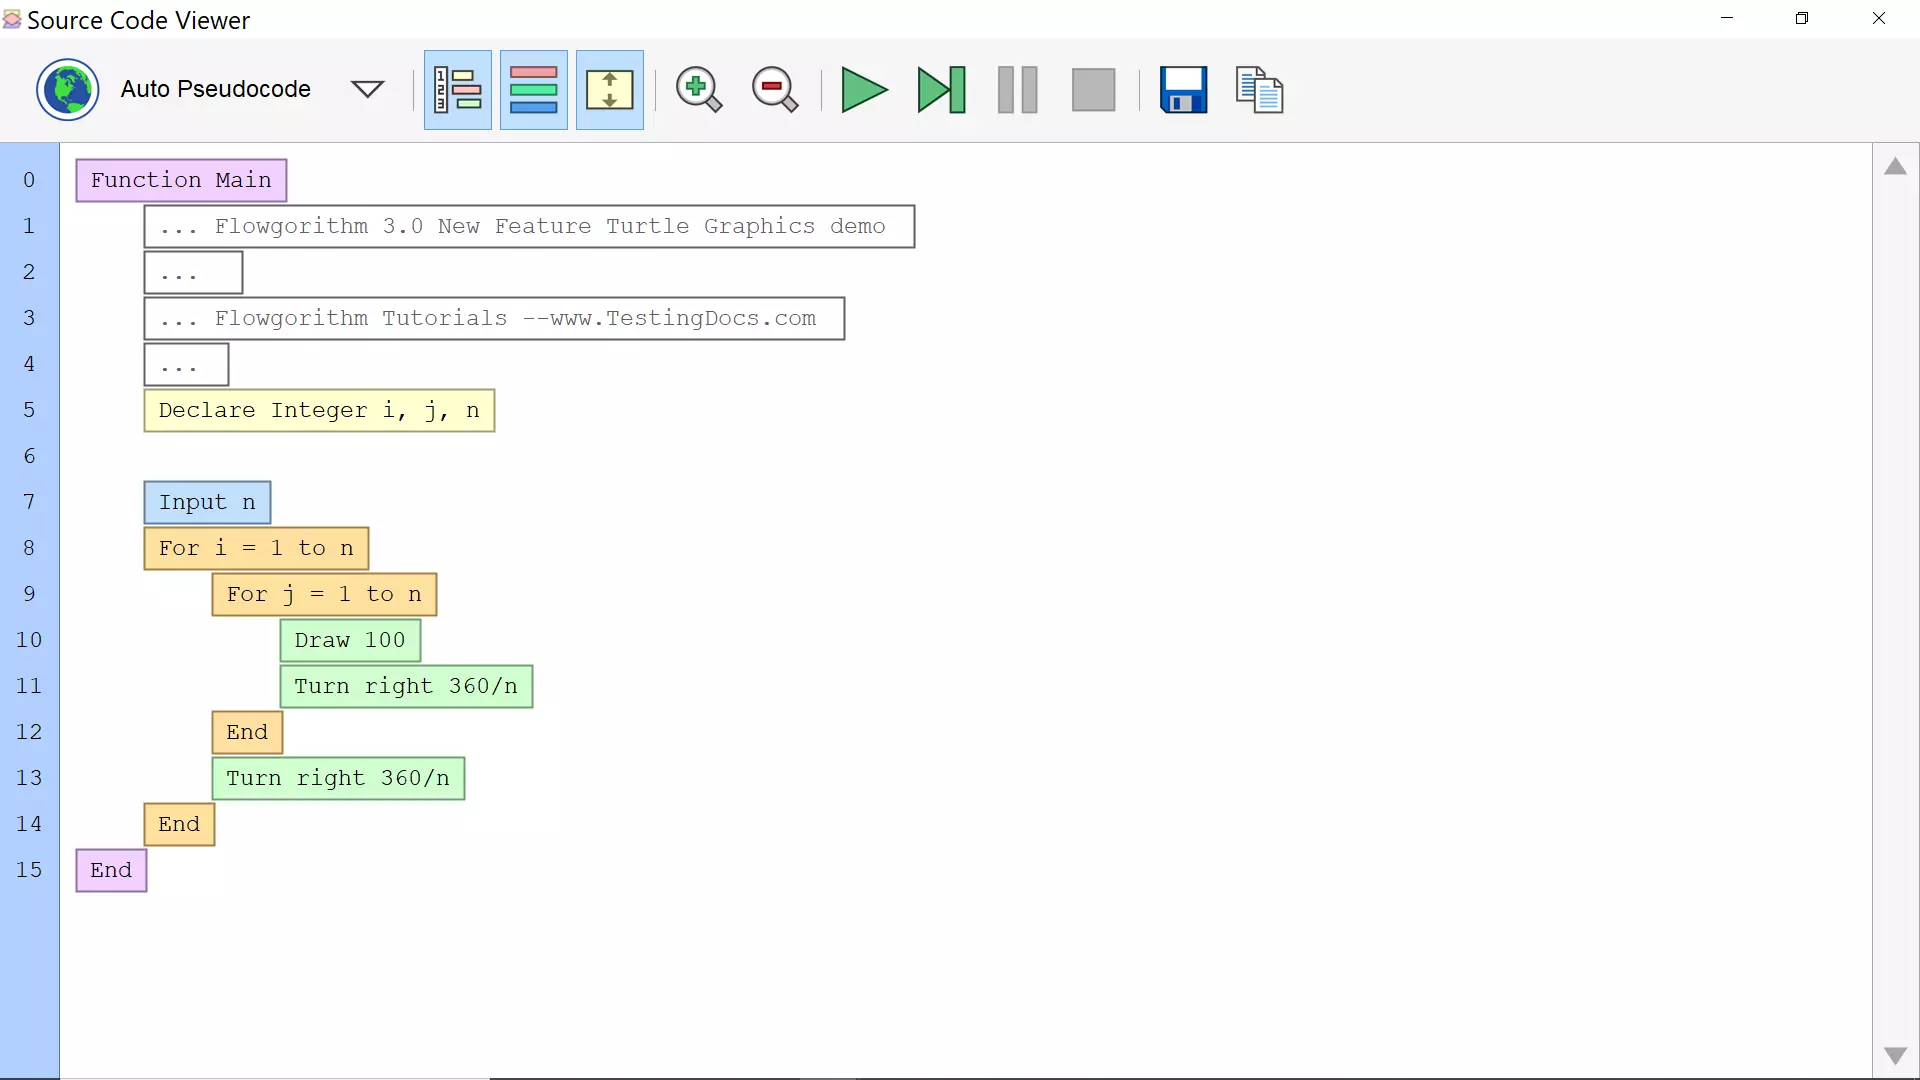
Pseudocode
Flowchart Output
With an input of 5, we will get the following drawing.
With an input of 40, we will get the following drawing.
That’s it. We have successfully created and executed a sample Turtle Graphics flowchart using Flowgorithm software.
Flowgorithm Tutorials
Flowgorithm flowchart tutorials on this website:


