TestingDocs.com
    Software Testing website
    • Automation
      • Selenium
      • JBehave Framework
    • Tutorials
      • MySQL Tutorials
      • Testlink
      • Maven
      • Git
    • IDEs
      • IntelliJ IDEA
      • Eclipse
    • Flowcharts
      • Flowgorithm
      • Raptor
    • About

    Selenium IDE

    Selenium IDE Components

    Overview

    In this tutorial, let’s understand the Selenium IDE Window Interface and the Selenium IDE Components. We need to get familiar with the tool UI so that we can develop effective automation tests.

    Selenium IDE Components

    Welcome Screen

    https://www.testingdocs.com/selenium-ide-welcome-screen/

    IDE GUI Components

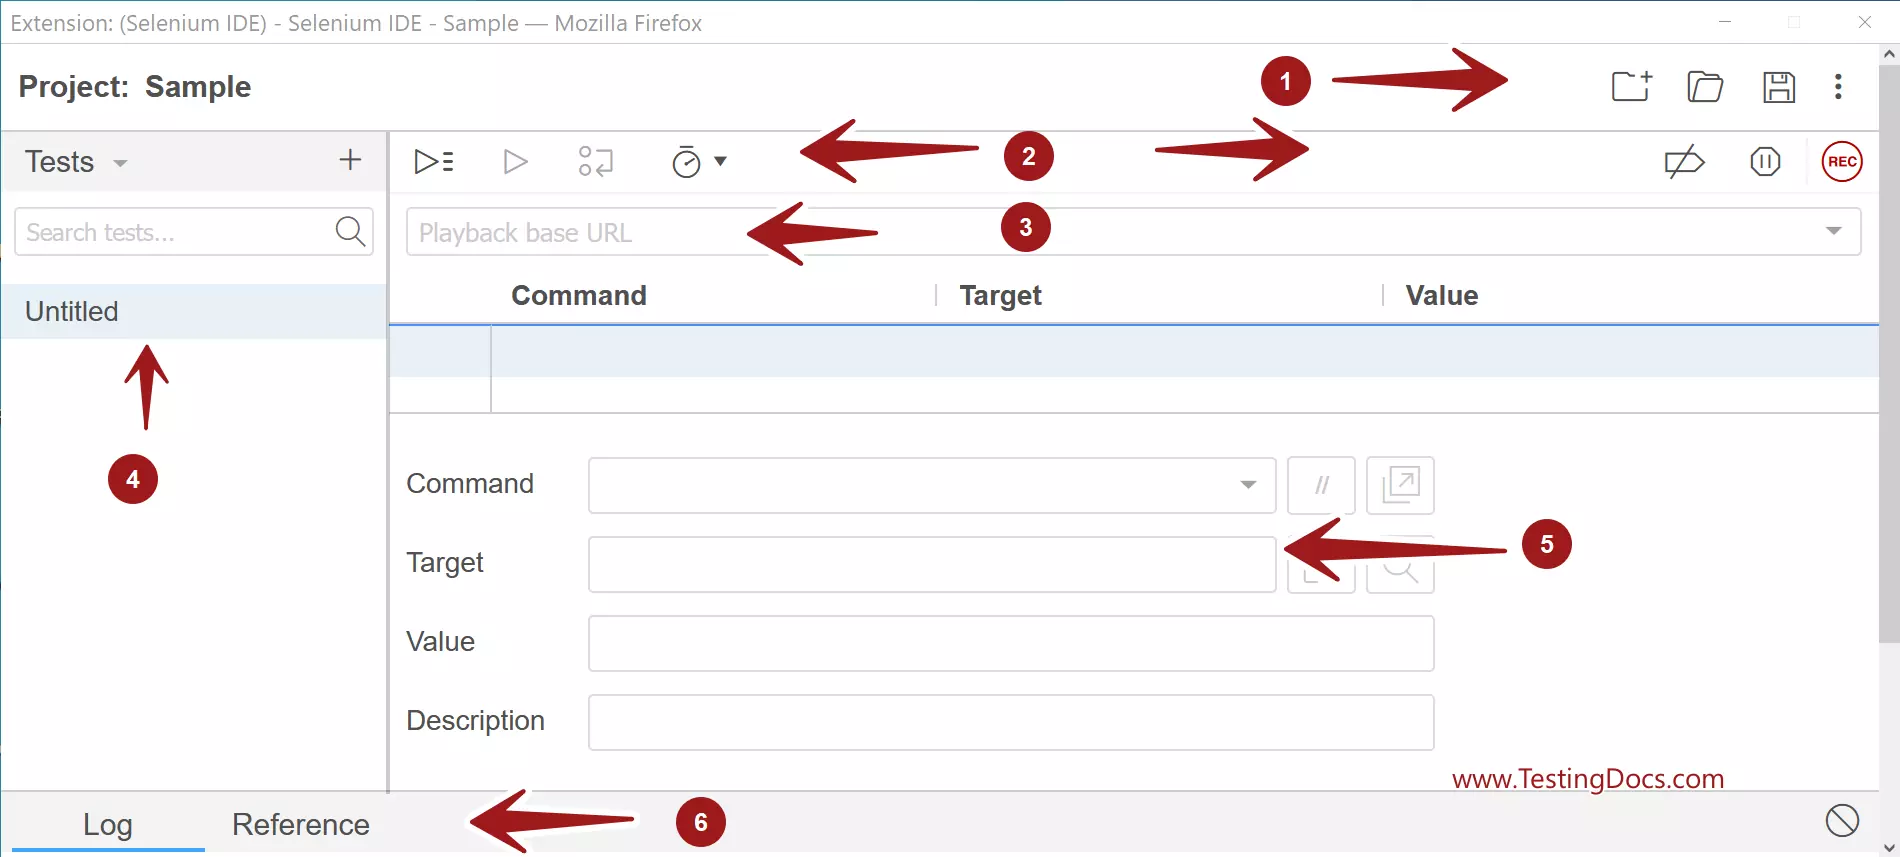
    The tool components are listed below:

    1. Menu
    2. Tool bar
    3. Address Bar
    4. Test Navigation Pane
    5. Test Script Editor
    6. Log & Reference Pane


    Selenium IDE Components


    Menu

    The menu includes icons for the frequently used actions, such as Create new project, Open project, Save Project and Help menu.

    Toolbar

    Tool bar contains icons for controlling the execution of the tests. The toolbar button are as follows:

    • Run all tests
    • Run current test
    • Step over current command
    • Test speed control
    • Disable  breakpoints
    • Pause on exceptions
    • Start Recording button.

    Address bar

    Address bar contains the playback base URL. This is the application under test base URL. Address bar is a drop down of all the URLs visited by the tool.

    Test Navigation Pane

    Navigation pane displays the list of all recorded tests. We can create Test suites and organize and group the tests into Test suites.

    Test Script Editor

    Test Script Editor pane displays the Selenese commands of the recorded test and user interactions during the recording by the IDE. The script editor contains three columns:

    • Command
    • Target
    • Value

    Log Pane

    Log window pane displays the runtime log messages during the test playback execution. The Reference window displays the details of the selected Selenese command in the Test Script Editor.

    —

    Selenium IDE Tutorial page:

    https://www.testingdocs.com/selenium-ide-tutorials/

    For More information on Selenium IDE:

    https://www.selenium.dev/selenium-ide/

    Related Posts

    Test Execution Speed Selenium IDE

    Selenium IDE /

    Test execution speed in Selenium IDE

    Session Not Created Error ChromeDriver

    Selenium IDE /

    Fix Error Session not created ChromeDriver

    ChromeDriver Not Found on PATH

    Selenium IDE /

    How to Fix ChromeDriver could not found on PATH

    Microsoft Edge Addon Store

    Selenium IDE /

    Install Selenium IDE on Microsoft Edge Browser

    Pause On exceptions Selenium IDE

    Selenium IDE /

    Debug Test Scripts in Selenium IDE

    ‹ Download Selenium IDE› Debug Test Scripts in Selenium IDE

    Recent Posts

    • Running Tests in Parallel with Selenium Grid
    • Advanced Selenium Features
    • Locating Web Elements
    • Running the Test Script
    • Writing Your First Selenium Test Script
    • Getting Started with Selenium Automation Testing
    • Setting Up the Environment
    • How can you monitor the Quality Assurance Audit?
    • Leveraging LambdaTest with Appium 2.0
    • Appium 2.0 Plugins ListAppium 2.0 Plugins
    • Touch Actions and Multi-Touch Actions
    • Changes in Drivers and Classes
    • Appium Inspector
    • Capabilities in Appium 2.0
    • Appium 2.0 Driver ListAppium 2.0 Driver Installation & Management
    CyberLink Multimedia Software

    Back to Top

    Links

    • Contact
    • Privacy Policy
    • Cookie Policy

    www.TestingDocs.com