TestingDocs.com
Software Testing website
  • Automation
    • Selenium
    • JBehave Framework
  • Tutorials
    • MySQL Tutorials
    • Testlink
    • Maven
    • Git
  • IDEs
    • IntelliJ IDEA
    • Eclipse
  • Flowcharts
    • Flowgorithm
    • Raptor
  • About

Automation

Cause and Effect Diagram

Overview

Fishbone diagram or Cause and Effect Diagram is one of the basic Quality tools. This tool is used to find the causes of the problem. The team needs to brainstorm on different categories of causes of the problem.

Fishbone diagram

A Sample Fishbone diagram is shown for finding the causes of Automation failures. The categories of causes are drawn as branches to the main arrow.


Fish Bone Diagram

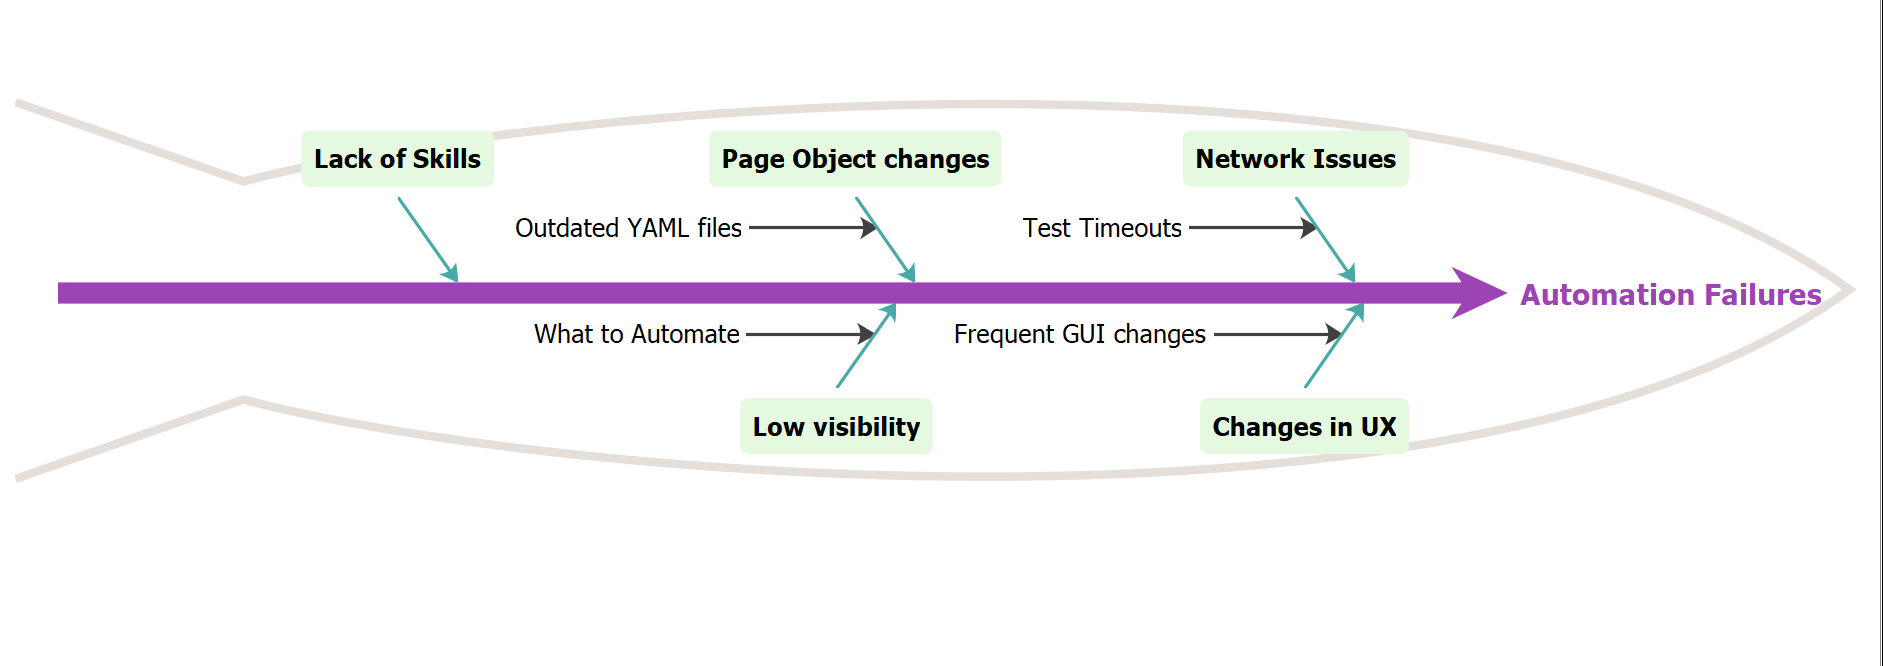
Some of the identified categories are:

  • Lack of Skills
  • Page Object Changes
  • Network Issues
  • Low visibility of Automation.
  • Changes in the Application UI.

Related Posts

Emma Tool

Automation /

Code Coverage Tools

Selenium 4 Automation Project

Automation /

Selenium 4 Project Setup on Ubuntu Linux

Testing webpage mobile-friendliness using a tool

Automation /

Testing webpage mobile-friendliness using a tool

Errors Code Testing Development

Automation /

Error Severity Metrics

Automation Environment Setup Verification

Automation /

Automation Environment Setup Verification

‹ Mobile Testing Automation Tools› Install Extensions for Visual Studio Code

Recent Posts

  • MS Access Data Types
  • Install RAPTOR Avalonia on CentOS
  • Download RAPTOR Avalonia Edition on Windows
  • npm doctor command
  • Build & Run CLion Project
  • Create New CLion C Project on Windows
  • Configure CLion Toolchains on Windows
  • Launch CLion IDE on Windows
  • Activate CLion IDE
  • CLion IDE for C/C++ Development

Back to Top

Links

  • Contact
  • Privacy Policy
  • Cookie Policy

www.TestingDocs.com

Go to mobile version