IPO Chart [ 2024 ]
IPO Chart
In this tutorial, we will learn about the IPO Chart. IPO stands for Input, Process, and Output. An IPO Chart is a valuable tool in computer programming and systems analysis to understand and describe how a system or process works.
Input Process Output
The IPO chart is a handy tool for problem-solving before designing the flowchart. It is a table with three columns. The columns are as follows:
- Input
- Process
- Output
The IPO chart is a breakout to determine the flowchart’s inputs, processing, and outputs.
⌨️ Input
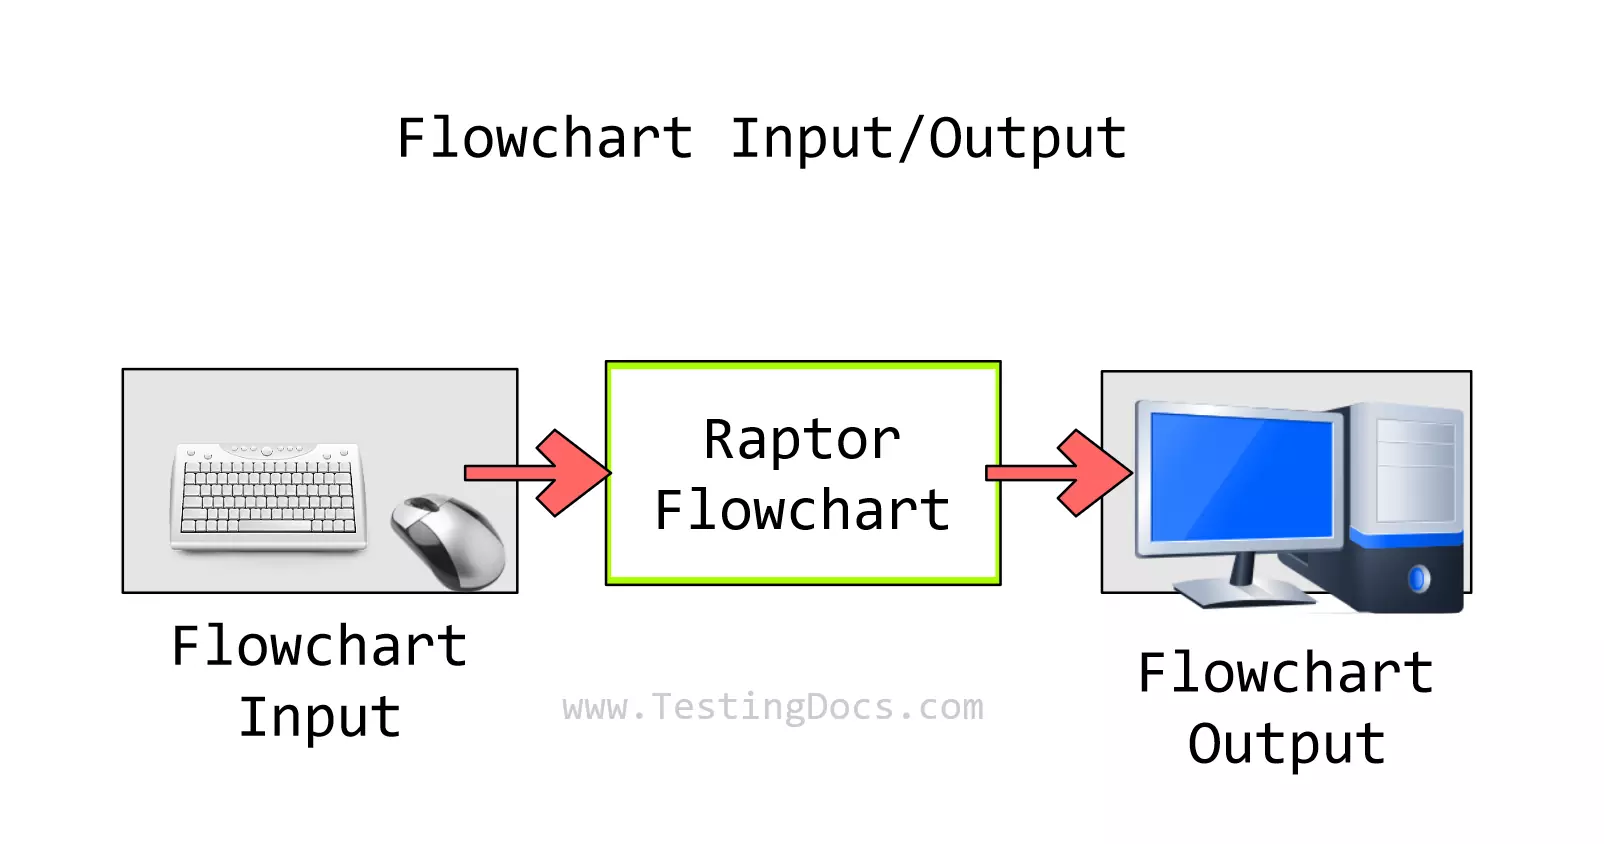
The Input column specifies the input to the flowchart entered in the Input dialog input file. The input column represents the data that is fed into a system. In programming, inputs can be anything from user data entered through a keyboard, data read from a file, or signals received from other systems. Inputs are the raw materials that the process will work upon.
⚙️ Process
Process columns contain the processing items, computations, and calculations done in the flowchart. The process stage is where the transformation of input data happens. The process can involve calculations, data manipulation, decision-making, or any actions that convert inputs into outputs. These processes are typically steps or algorithms written in programming language code.
💻 Output
Outputs are the results of the process acting on the input data. They could be data displayed on the computer screen, data written to a file, signals sent to other systems, etc. Outputs are the end products or results of the system’s process.
In Raptor flowchart, the Output column specifies the output of the flowchart displayed in the Master Console window, output file, etc.
Example
An IPO chart is typically drawn as a table or a flowchart. It helps plan a program or system by clearly defining what data is required, what needs to be done, and what should be produced.
Let’s look at a simple example of a flowchart to compute the area of the rectangle. The IPO chart for the flowchart would be:
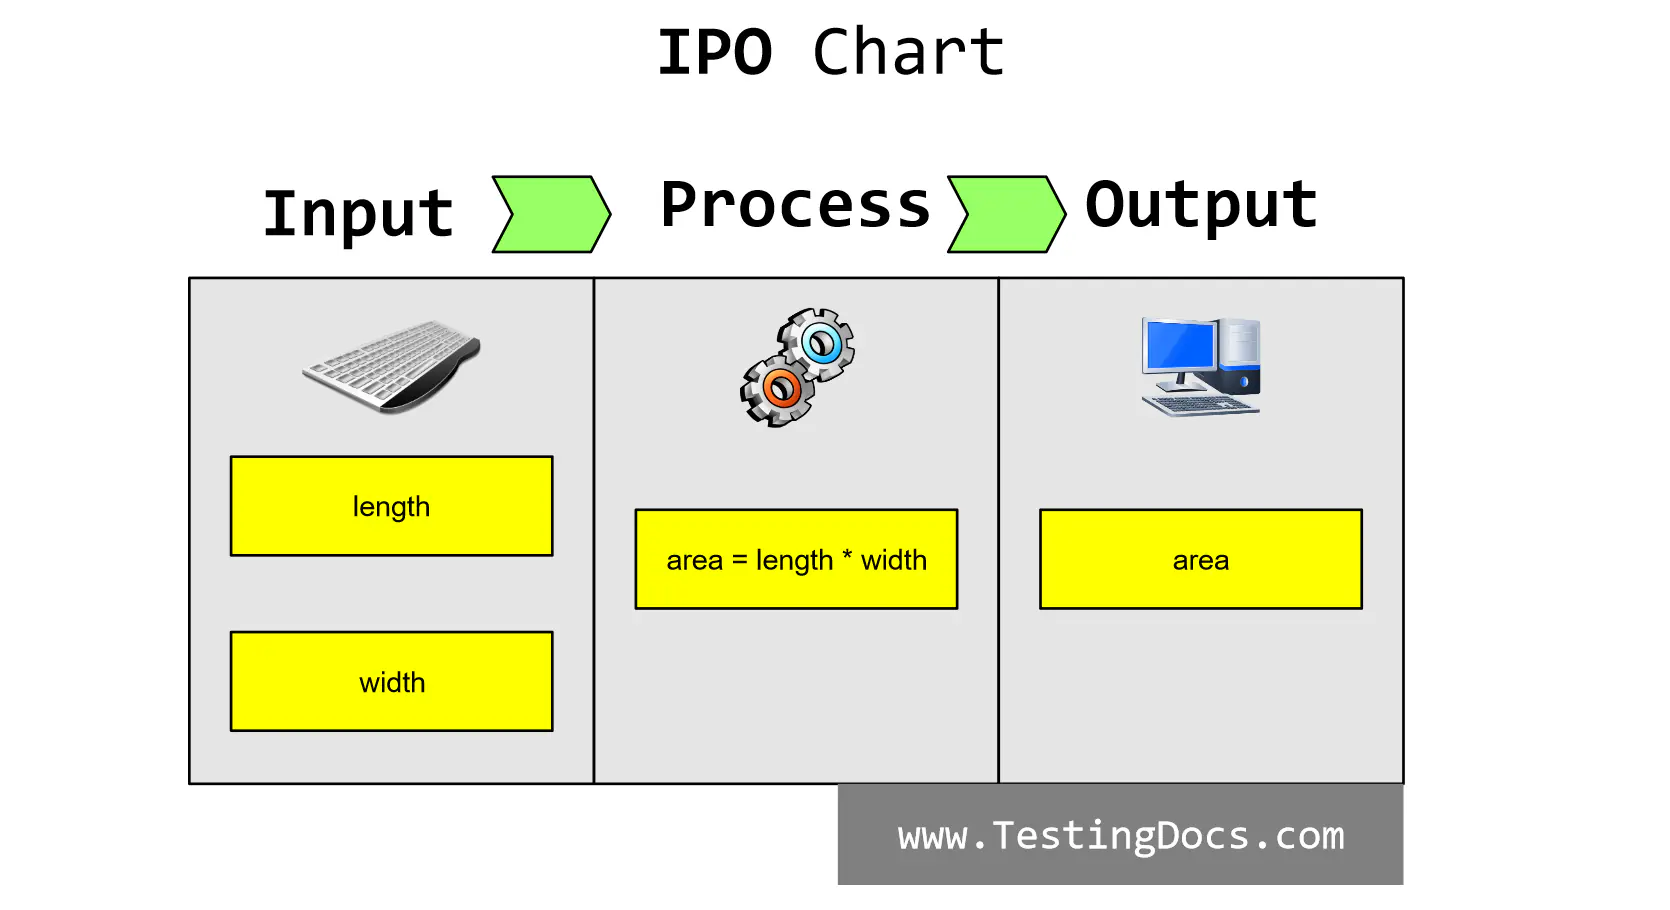
The input column lists the input for the flowchart. We need the rectangle’s length and width to compute the area, so the length and width are the input for the flowchart.
The process column contains the processing of the input to provide valuable information to the user in the form of the output. To compute the rectangle area, we need to multiply the length and the width of the rectangle.
area= length * width
The output provides the user with the required output, the area of the rectangle. To enhance the user experience, we can replay the input variables on the output screen.
RAPTOR Tutorials
RAPTOR tutorial page:


