Linux Commands to Monitor System
Linux Commands to Monitor System
In this tutorial, we will look at some of the Linux commands to monitor the system runtime performance of various resources of the system. These commands would help to monitor the load on the system during various kinds of performance testing.
Linux Commands
Some of the commands are as follows:
- free
- top
- vmstat
- iostat
free
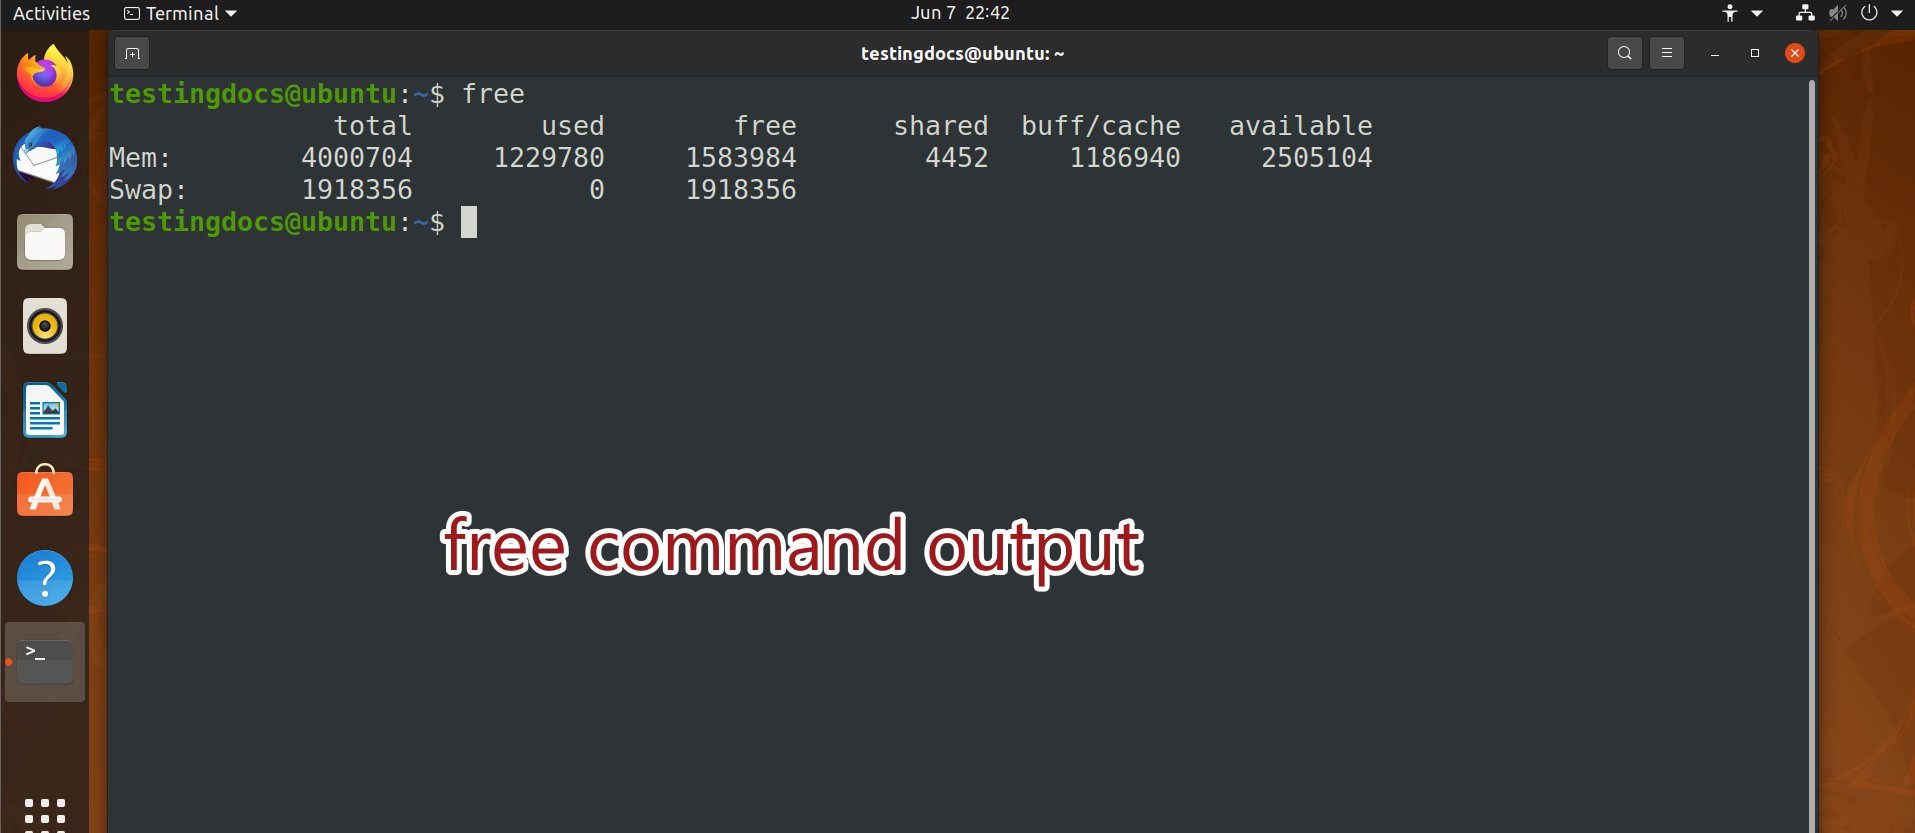
The free command displays the total amount of free and used physical and swap memory in the system. The information is obtained from /proc/meminfo
free memory = total – used – buffer – cache
top
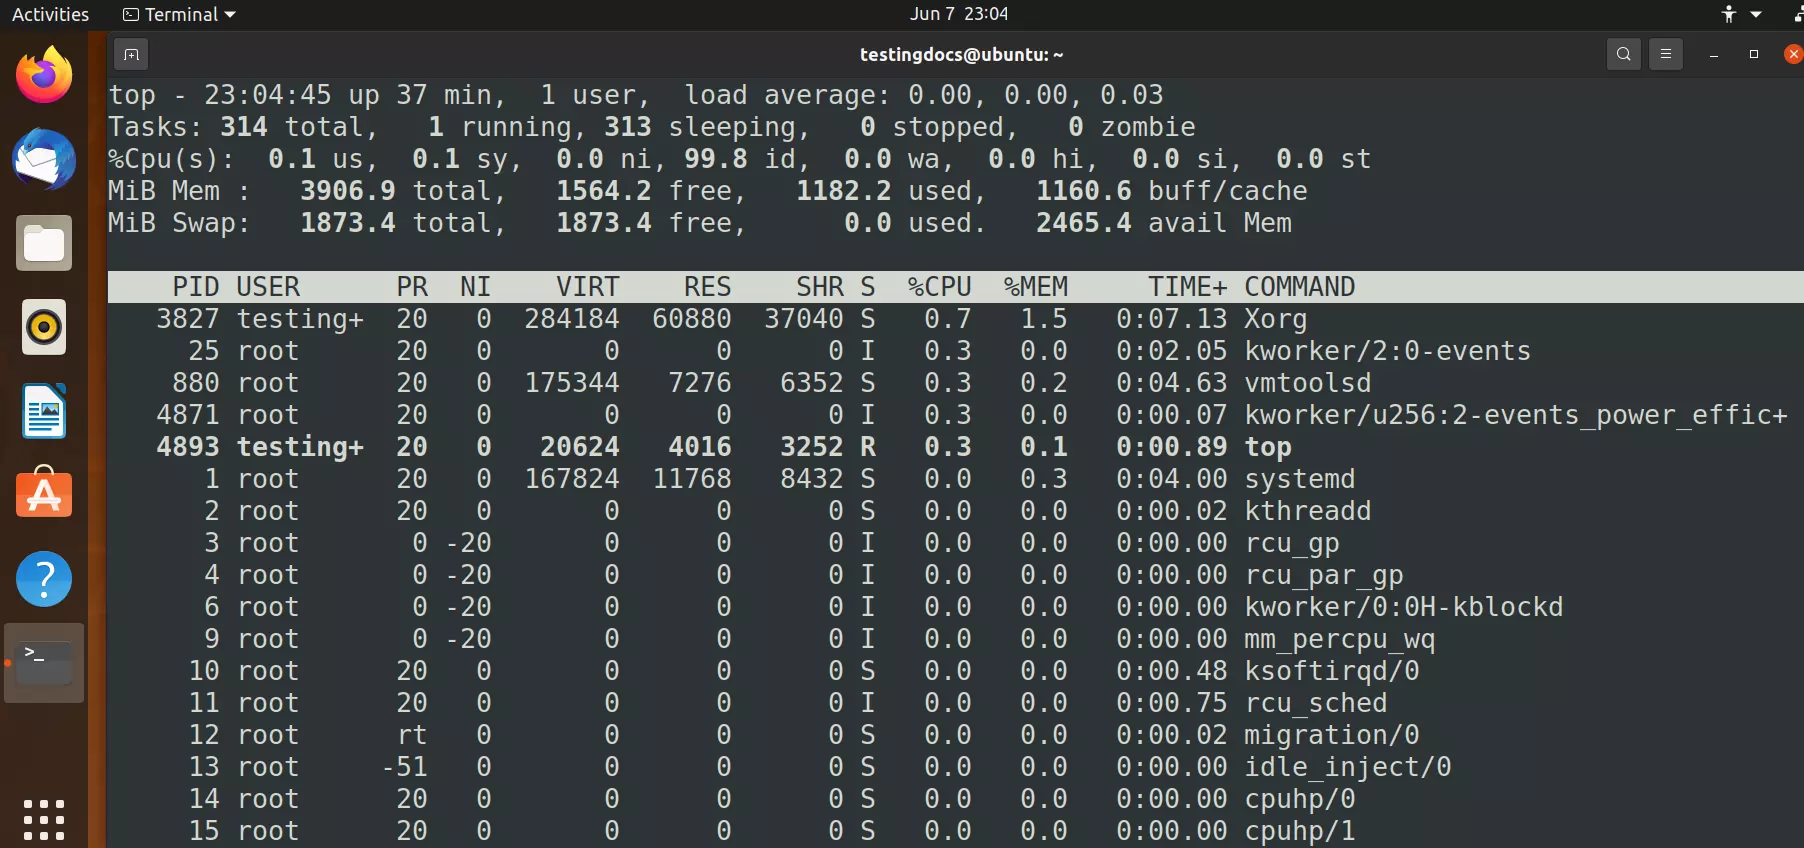
The top command displays the current running processes along with the CPU, RAM, and swap usage. The command is dynamic i.e if you leave the terminal running this command, the information keeps on updating in real-time.
The free command is not dynamic like the top command. We need to run the free command multiple times to know the memory stats. For example, during memory leak testing run the free command before the test. Run the suspected operation or activity that leaks memory. Run the free command after the action. Analyze the results to know if the operation leaks the memory.
vmstat
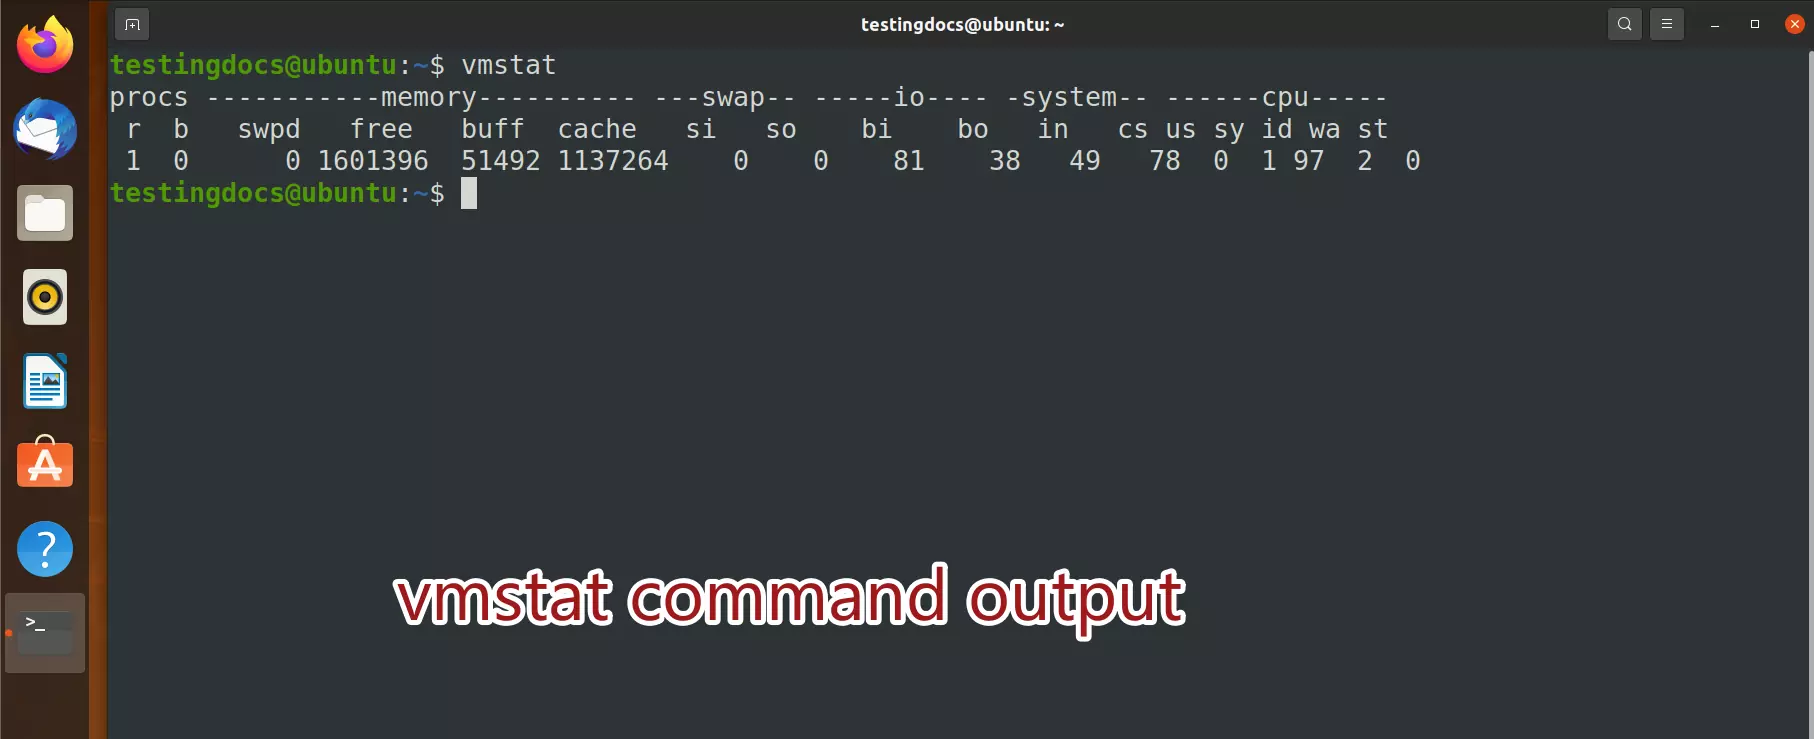
The vmstat command reports the virtual memory stats on the system. Information of memory, paging, block IO, CPU activity, etc.
iostat
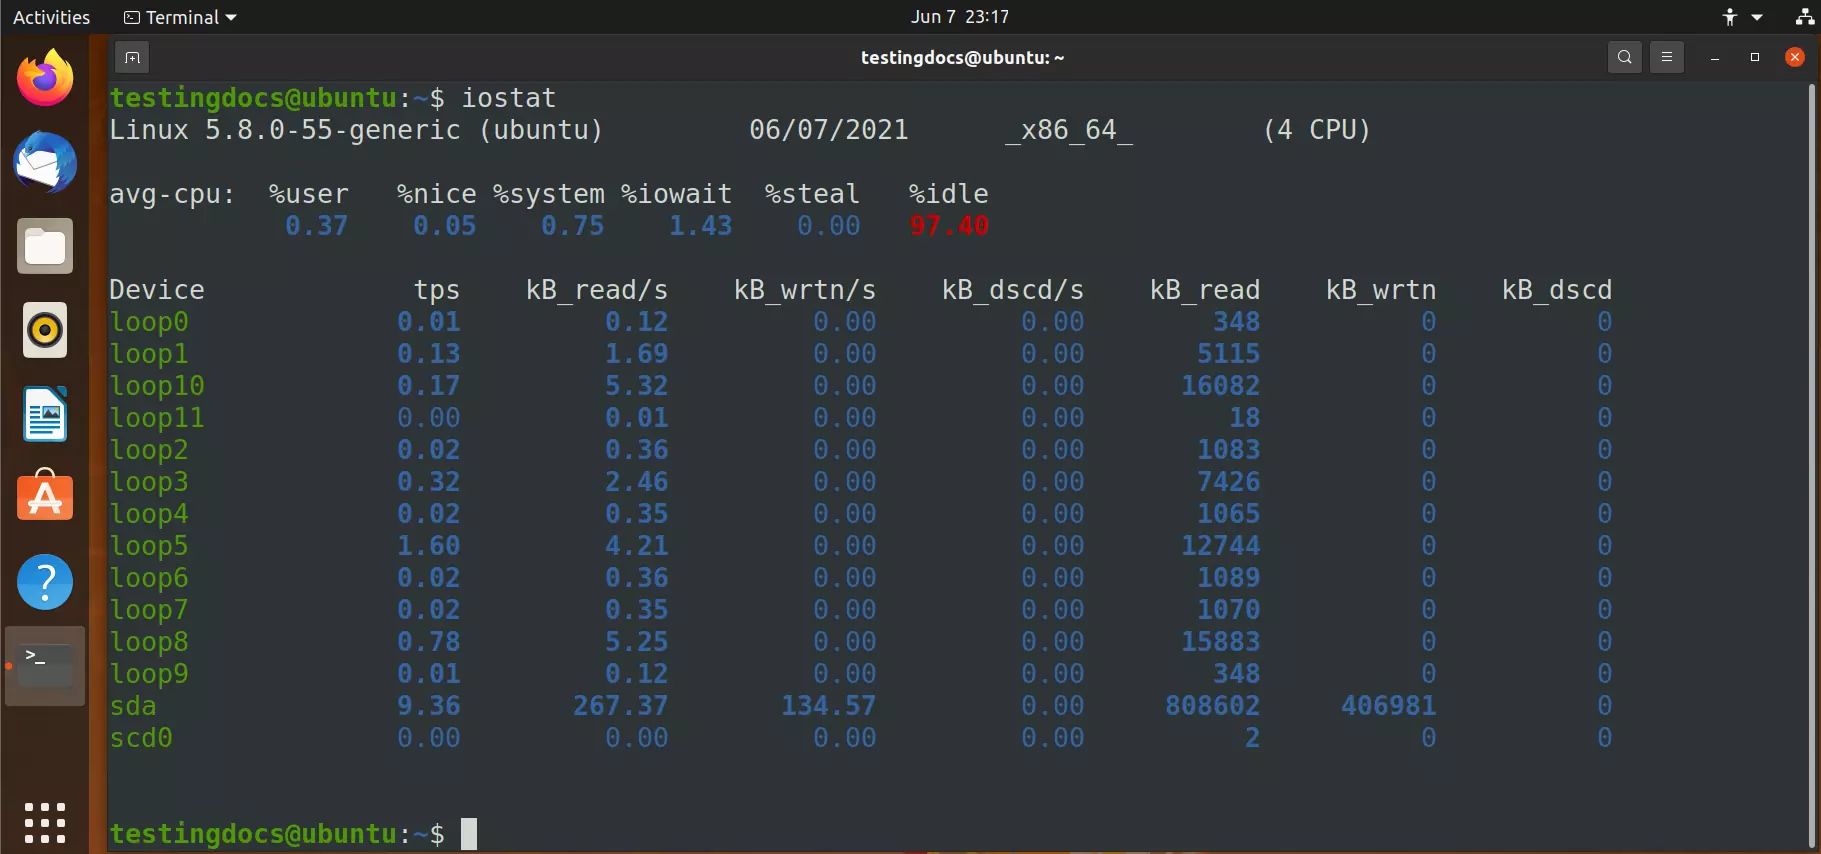
The iostat command is used to monitor the input/output device load and average transfer rates. The main reports of this command are CPU utilization and the IO device utilization report.
sar
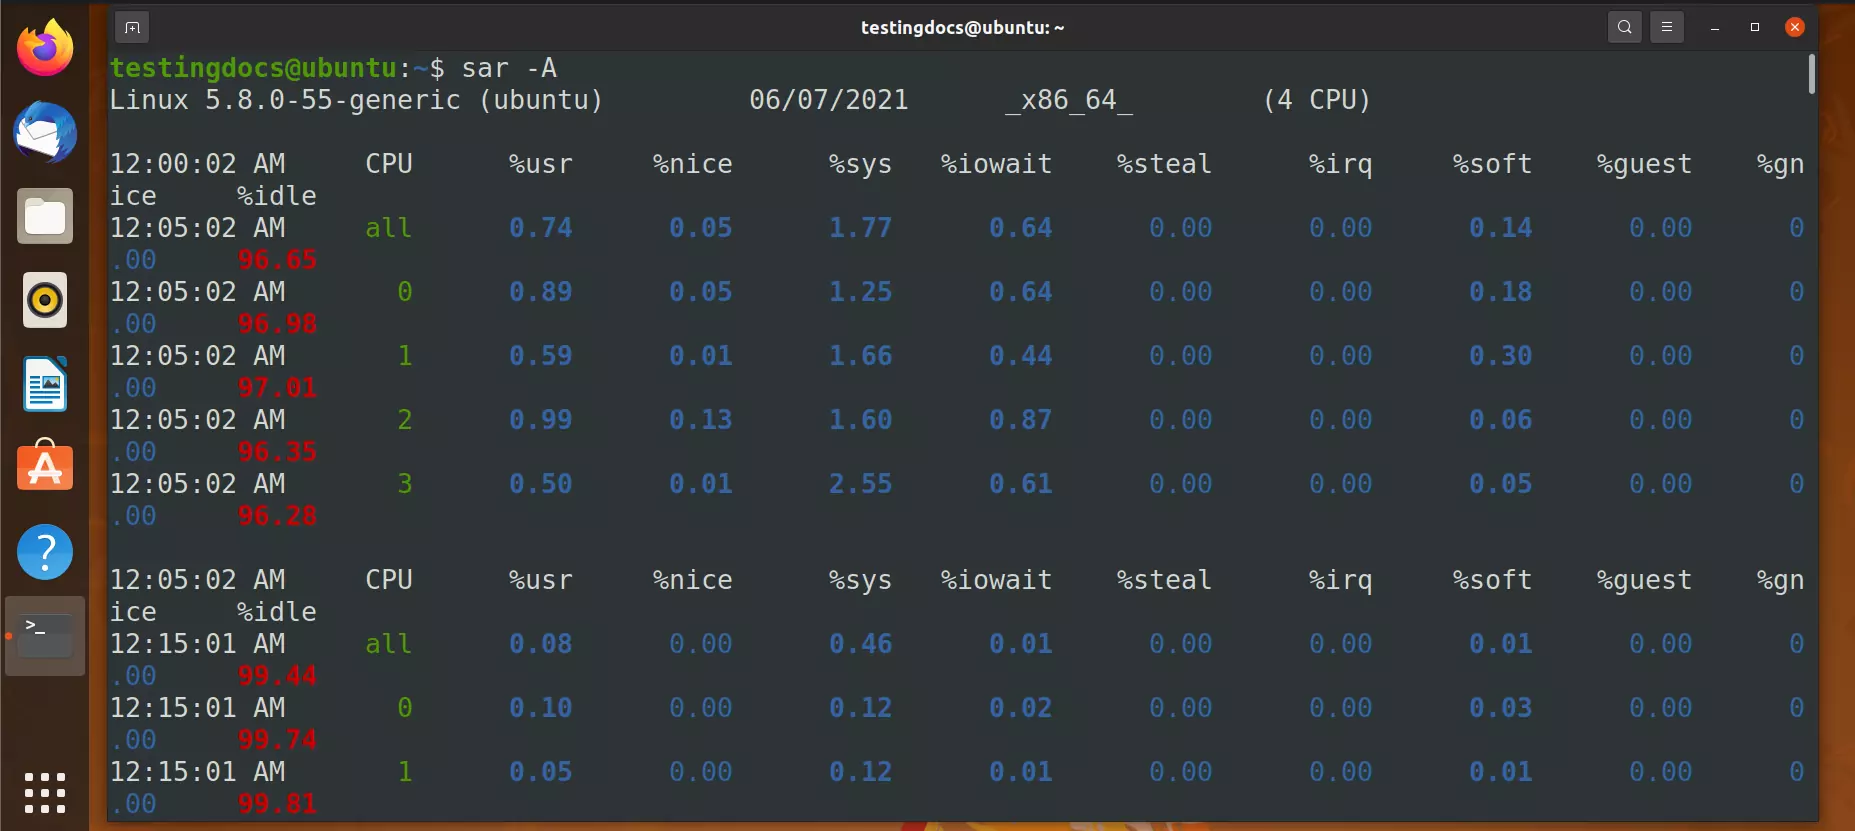
The sar command is used to collect and save system activity reports on a regular basis. The files are stored under /var/log/sysstat directory by default. The file names would be saDD or saYYYYMMDD formats.
The sample output of the command:
$ sar -A
Popular Linux distributions:
https://www.testingdocs.com/popular-linux-distributions/
More information on Linux:

